Visualizing bike stations live data
Recently some friends and I decided to launch openbikes.co, a website for visualizing (and later on analyzing) urban bike traffic. We have a lot of ideas that we will progressively implement. Anyway, the point is that all of it started with me fiddling about with the JCDecaux API and the leaflet.js library and I would like to share it with you. Shall we?
Presentation
In this post I want to show you the tools and the code to get a fully functional website for visualizing live data. In this particular case we will display bike stations in Toulouse, however I will keep the scripts as general as possible so they are easily modifiable for different data. Before starting here is a glimpse of the end result:
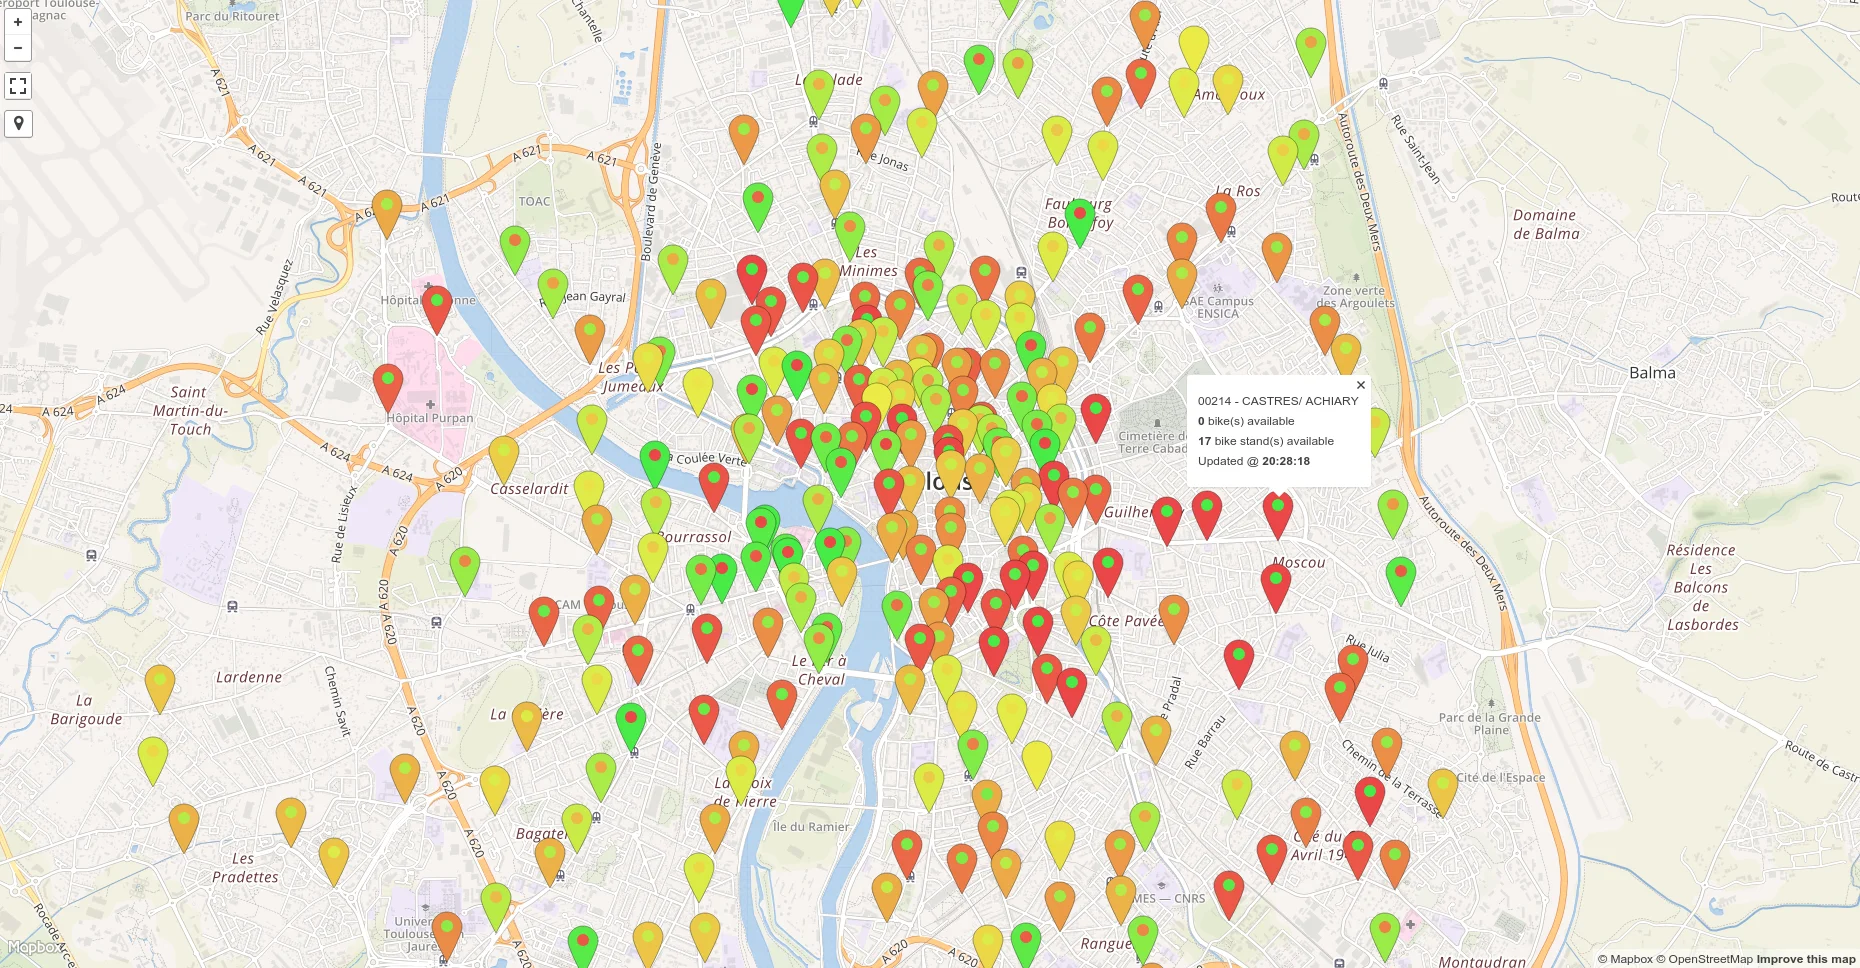
Pretty neat right? The marker color represents how many bikes are available and the circle in the center of each marker shows how many bike stands are available. In both cases, the greener the marker the higher the amount (a red) indicator means not a lot. Thus yellow means that the bike station is “balanced”. The cool thing is that you can set this up to update every minute or so.
Tools
I’ll be doing this in Python (3, but it shouldn’t matter). Only two modules are needed: pandas (manipulating data frames) and flask (making and hosting a website). Both should be very easy to install on any platform as they are extremely popular modules.
Download the leaflet vector marker library (click on Download ZIP towards the bottom-right). All the other JavaScript libraries are accessible via the internet and don’t need downloading.
Data will be collected from the JCDecaux API, if you don’t know what an API is don’t worry. However you will have to obtain a registration key because I cannot give you mine. The reason why most APIs require users to have a registration key is so bots can’t overflow their servers and slow/crash them.
That’s it. You might want to use a nice text editor such as sublime for the HTML/JavaScript part. Also the markers on the map might not render well for deprecated navigator versions or with Internet Explorer, however everything certainly works with Chrome.
Prior on APIs
Very briefly, an API returns data to a user based on a query that was sent to it. The queries take the shape of URLs. In each URL you can specify parameters so as to retrieve different data. Most of the time the API will return the data as a JSON file (I haven’t encountered any other formats yet but they do exist) so knowing how to parse them is important. What’s cool with Python is that JSON files are exactly like dictionaries.
Just like a website, an API is hosted on a server, which means that technically it could “break” if too many people query the API too quickly. For the API there isn’t much difference between it sending all of its data or just piece of it. What matters is how many times you interrogate it, not for how much. In our case we may as well interrogate the JCDecaux API on all of the stations for a city and not iteratively for every station (it would be longer and they wouldn’t be happy).
As general politeness it’s always a good idea to send a mail to the people who made the API to ask them how robust the API and how regularly queries can be sent to it. Also you should thank them for their awesome work :). Sometimes they indicate all of the information on their website. They also should indicate what each variable corresponds to in the data the API returns because it always also very obvious.
Structure
First of all let’s define an elegant structure for the project:
bikes/
    static/
        js/
            Leaflet.vector-markers.min.js
            Leaflet.vector-markers.js
        data/
            Toulouse.csv
        css/
            Leaflet.vector-markers.css
            Leaflet.vector-markers.css.map
    lib/
        __init__.py
        JCDecaux.py
    templates/
        index.html
    serve.py
    update.py
The website will be hosted with flask, with this particular framework all the files related to the website are either in the static folder or in the templates folder.
The static folder contains the CSS and JavaScript files that are not available online (in this case only the vector markers library that you should have downloaded) plus a CSV file for each city. The idea is that every minute or so (it will be a parameter) we will query the API for a city and replace the CSV file.
The templates folder regroups the pages of the website. In this case there is only one page. However if we were to add more cities we could just add an HTML file for each city.
The rest of the files are Python scripts for manipulating the data, I’ll get to them now.
Collecting the data
JCDecaux provides a very nice API for obtaining data about bikes stations in real time. My idea on the long term was to create a package of scripts for collecting data from different APIs and making it all uniform. In this case the package is called lib. For it to be a real Python package you have to add an empty file called__init__.py. In this file you can create a script called JCDecaux.py and then open it.
First of all let’s import the modules we need to deal with the API (all of them apart from pandas should be available by default with your Python distribution).
from six.moves.urllib.request import urlopen
import json
import pandas as pd
from datetime import datetime
Next let’s define some variables.
key = 'copy/paste your key here!'
base = 'https://api.jcdecaux.com/vls/v1/'
Add the key (between quotes) that was given to you after you registered to JCDecaux. The base variable is the first part of the API, it doesn’t change for any query and so it’s better to save it to a variable.
Now let’s define a function for interrogating the API.
def query_API(url):
    # Send a query to the API and decode the bytes it returns
    query = urlopen(url).read().decode('utf-8')
    # Return the obtained string as a dictionary
    return json.loads(query)
If you pass into this function a URL, it will return a dictionary containing all the data as a dictionary.
Next we need a function that interrogates the API for all the stations in a given city.
def stations_list(city):
    url = base + 'stations/?contract={0}&apiKey={1}'.format(city, key)
    data = query_API(url)
    return data
First we specify the URL to send to the API. In the URL we specify the city name (JCDecaux calls this a contract) and the API key that we stored previously. Then we can use the function we made before to send to URL to the API and get the data we want.
Here is an example of it actually returns:
{
  "contract_name": "Toulouse",
  "banking": "True",
  "status": "OPEN",
  "bonus": "False",
  "available_bike_stands": 19,
  "bike_stands": 19,
  "number": 34,
  "address": "2 PETITE RUE SAINT LAZARE",
  "position": {
    "lng": 1.446076879873296, "lat": 43.609650036285025
  },
  "last_update": 1433367891000,
  "name": "00034 - SAINT LAZARE",
  "available_bikes": 0}
This is data for one station, the query we send actually returns a list of these.
You might notice that JCDecaux’s API return timestamps for indicating at which time each station was last updated. These can easily be converted to a hh:mm:ss format.
def timestamp_to_ISO(timestamp):
    moment = datetime.fromtimestamp(timestamp / 1000)
    return moment.time().isoformat()
Now let’s put everything together!
def information(city):
    # Collect JSON data
    data = stations_list(city)
    # Convert it to a dataframe
    df = pd.io.json.DataFrame(data)
    # The positions are embedded so they have to be extracted
    positions = df.position.apply(pd.Series)
    df['latitude'] = positions['lat']
    df['longitude'] = positions['lng']
    # Make the timestamps human readable
    df['last_update'] = df['last_update'].apply(timestamp_to_ISO)
    return df[['available_bikes', 'last_update', 'name', 'latitude',
               'longitude', 'available_bike_stands', 'bike_stands',
               'status']]
I think the function and the comments speak for themselves but I will go through it in plain english. The function takes a city as a parameter and returns a dataframe. We start by collecting the API as a JSON file with the script we wrote before. As you can see in the example the position of each station is embedded, which means that converting the dictionary to a dataframe doesn’t work straight away and puts both into a single column. However as the code shows this isn’t difficult to circumvent. The dataframes provided by pandas are really useful, converting all the timestamps to a format comprehensible by humans is a one-liner. with .apply. Finally we decide to only return the columns that we will use, indeed as you can see in the example above the API returns more information than we need.
We’re done with the API interrogation! Now we can create a update.py script in the parent folder and add the following code.
from lib import JCDecaux as jcd
import time

city = 'Toulouse'

while True:
    dataframe = jcd.information(city)
    dataframe.to_csv('static/data/{0}.csv'.format(city), index=False)
    time.sleep(60)
In this script we use the the code we wrote previously as a module. This makes it really tidy. If we had other scripts for interrogating different APIs we could just import them in this “main” script and voilà. The script itself is not too complicated, we simply loop forever and interrogate the API every 60 seconds (change it as you please). The dataframe we build is saved to static folder which flask will be able to read. The architecture of the project is efficient, indeed instead of just one city we could add an inner for loop the while loop and iterate over a list of cities without having to change the JCDecaux.py
Making a map
Let’s add a file called index.html to the templates folder, this will contain the map of Toulouse but it will easily be adaptable for other cities.
First of all let’s import all the libraries we will need.
<!DOCTYPE html>
<html>
    <head>
        <meta charset='utf-8'/>
        <title>Bike stations</title>
        <meta name='viewport' content='initial-scale=1,maximum-scale=1,user-scalable=no'/>
        <!-- Leaflet JS -->
        <script src='https://api.tiles.mapbox.com/mapbox.js/v2.1.9/mapbox.js'></script>
		<!-- Leaflet CSS -->
		<link href='https://api.tiles.mapbox.com/mapbox.js/v2.1.9/mapbox.css' rel='stylesheet'/>
		<!-- Font-awesome -->
        <link rel="stylesheet" href="//maxcdn.bootstrapcdn.com/font-awesome/4.3.0/css/font-awesome.min.css">
        <!-- Leaflet vector markers -->
        <link rel="stylesheet" href="{{ url_for('static', filename='css/Leaflet.vector-markers.css') }}"/>
        <script src="{{ url_for('static', filename='js/Leaflet.vector-markers.js') }}"></script>
        <!-- Leaflet omnivore -->
        <script src='https://api.tiles.mapbox.com/mapbox.js/plugins/leaflet-omnivore/v0.2.0/leaflet-omnivore.min.js'></script>
        <style>
            body { margin:0; padding:0; }
            #map { position:absolute; top:0; bottom:0; width:100%; }
        </style>
    </head>
Leaflet is the “main” library we will use for displaying maps. It’s lightweight and has a lot of plugins. Most of the plugins and leaflet itself are available for importing online, in other words you don’t need to have as physical files. The downside of this is that the script are slightly lower to load the first time you open the HTML file in your browser. However the file will load faster the next times you open it because your browser will remember opening it. In our case only the the vector markers library isn’t available online.
For the sake of showing leaflet’s possibilities let’s add two plugins.
<body>
<!-- Fullscreen plugin -->
<script src='https://api.tiles.mapbox.com/mapbox.js/plugins/leaflet-fullscreen/v0.0.4/Leaflet.fullscreen.min.js'></script>
<link href='https://api.tiles.mapbox.com/mapbox.js/plugins/leaflet-fullscreen/v0.0.4/leaflet.fullscreen.css' rel='stylesheet' />
<!-- User location plugin -->
<script src='https://api.tiles.mapbox.com/mapbox.js/plugins/leaflet-locatecontrol/v0.42.0/L.Control.Locate.min.js'></script>
<link href='https://api.tiles.mapbox.com/mapbox.js/plugins/leaflet-locatecontrol/v0.42.0/L.Control.Locate.mapbox.css' rel='stylesheet' />
These specific plugins add two buttons to the top-left of the map, one puts the map to fullscreen and the other pinpoints the user’s location on the map with a blue circle.
We create the map by creating a <div> object that will cover the whole page.
<div id='map'></div>
The rest of the file is JavaScript to put all the libraries together.
First of all we need a function that returns a color based on the number of bikes or the number of bike stands available. The modern way to do this is to use the HSL standard. To be honest I am no expert in JavaScript or in colors, I found some snippet on StackExchange and adapted it to go from red to green.
<script>
// transform a value from 0 to 1 into a color
function getColor(value){
	var hue=((1-value)*120).toString(10);
	return ["hsl(",hue,",80%,60%)"].join("");
}
Next let’s edit the map.
L.mapbox.accessToken = 'pk.eyJ1IjoibGVtYXgiLCJhIjoidnNDV1kzNCJ9.iH26jLhEuimYd6vLOO6v1g';
var map = L.mapbox.map('map', 'mapbox.emerald', {
maxZoom: 20
})
// initial location
map.setView([43.60426, 1.44367], 14);
// add plugins
L.control.fullscreen().addTo(map);
L.control.locate().addTo(map);
We start by defining the map and giving the emerald style available on mapbox. On mapbox you can also create your own maps but that’s another matter altogether. Then we center it on Toulouse (use google for other cities). Finally we activate the two plugins we imported.
Now the last piece of puzzle is to convert the CSV files we generate with Python into markers on the map. For this we use omnivore library. omnivore is very smart, you just have to point it to a CSV file containing columns resembling “latitude” or “lat” (the same goes for the longitudes) and it will do all the work in the background.
omnivore.csv("{{ url_for('static', filename='assets/files/Toulouse.csv') }}", null, L.mapbox.featureLayer())
.on('ready', function(layer) {
this.eachLayer(function(marker) {
var info = marker.toGeoJSON().properties
var bikes = info.available_bikes
var stands = info.available_bike_stands
var total = info.bike_stands
var update = info.last_update
var icon = L.VectorMarkers.icon({
	icon: 'circle',
	markerColor: getColor(1 - bikes / total),
	iconColor: getColor(1 - stands / total)
});
// change the icons for each point on the map
marker.setIcon(icon)
// create popup text to display the date, city, and country of the GPS data point
var popupText =
marker.toGeoJSON().properties.name +
'</br>' +
'<b>' + bikes + '</b>' + ' bike(s) available' +
'</br>' +
'<b>' + stands + '</b>' + ' bike stand(s) available' +
'</br>' +
'Updated @ ' + '<b>' + update + '</b>';
// bind the popup to each icon
marker.bindPopup(popupText);
});
})
.addTo(map);
</script>
The info variable stores the data from all the columns for each row. We define an icon variable where we use the getColor() function defined earlier to color the marker and the circle in the middle of the marker based on the relative number of bikes or bike stands available. Then we tell omnivore that the marker inherits it’s graphics from the icon we just created. Finally we create a popupText variable for when the user clicks on a marker and bind it to the marker.
Don’t forget to close the HTML tags :).
</body>
</html>
I don’t know what you think but I find that leaflet is very neat and the code is comprehensible. I myself had never done any JavaScript and this didn’t take me long to pick up.
Running the website
We’re nearly done, we just have to run the website thanks to flask. The reason why we can’t just open the index.html is because the script has to get data from a folder, and a browser on it’s own can’t do that. Another way of doing this would be to put everything in the htdocs folder of Apache and navigate to it in the browser, however I find that Apache is annoying to manipulate and sharing code with other people can become annoying.
Create a serve.py file and add the following code.
from flask import Flask, render_template

app = Flask(__name__)

@app.route('/')
def index():
    return render_template('index.html')

if __name__ == '__main__':
    app.run()
The point of this blog post isn’t to explain Flask to you, if you want to learn more about it visit their website, it’s very well made. If you run this script and type localhost:5000 in your browser you should see the map!
Flask really shines here, if I want to send this to one of my friends so he/she can edit it (for example add more maps) he/she won’t have to bother with Apache.
To sum things up, if you want to run the website constantly you have to execute update.py and serve.py without stoping them. To do this properly and also to have a real URL point to the website you will have run all this on a Linux server with daemons. However all this enters another realm and is out of the scope of this post.
I hope you enjoyed the post.