Comic book panel segmentation
Table of contents
Edit (2023-05-26) – I’ve learnt about the Kumiko project, which is exactly devoted to slicing comic book panels. There’s even a live tool. I discovered it thanks to being pinged on this issue.
Motivation
I’ve recently been reading some comic books I used to devour as a kid. Especially those from the golden era of francophone comics: Thorgal, Lanfeust, XIII, Tintin, Largo Winch, Blacksad, Aldebaran, etc.
It’s not easy to get my hands on many of them. Luckily enough I found a website called ReadComicOnline which is delightfully profuse. It gives access to comics for free under the murky “fair use” copyright doctrine. I’m very doubtful about the legality of the website, but I’m still using it for lack of a better option.
I usually read these comics on my laptop. Reading them on my phone is not very convenient. I have to zoom in and move too many times to go from one panel to the next. I was thinking it might be easier if I could tap the screen to go from one panel to the next. That seems possible if the panels were cut up in pieces. It occurred to me that cutting up comic strip panels boils down to an image segmentation task.
I decided to have a go and write some Python code to segment a comic strip page. I thought it would be nice to document the steps I took. In particular, I made heavy use of scikit-image; so you could say this blog post is a tutorial on doing image segmentation with scikit-image.
Loading an image
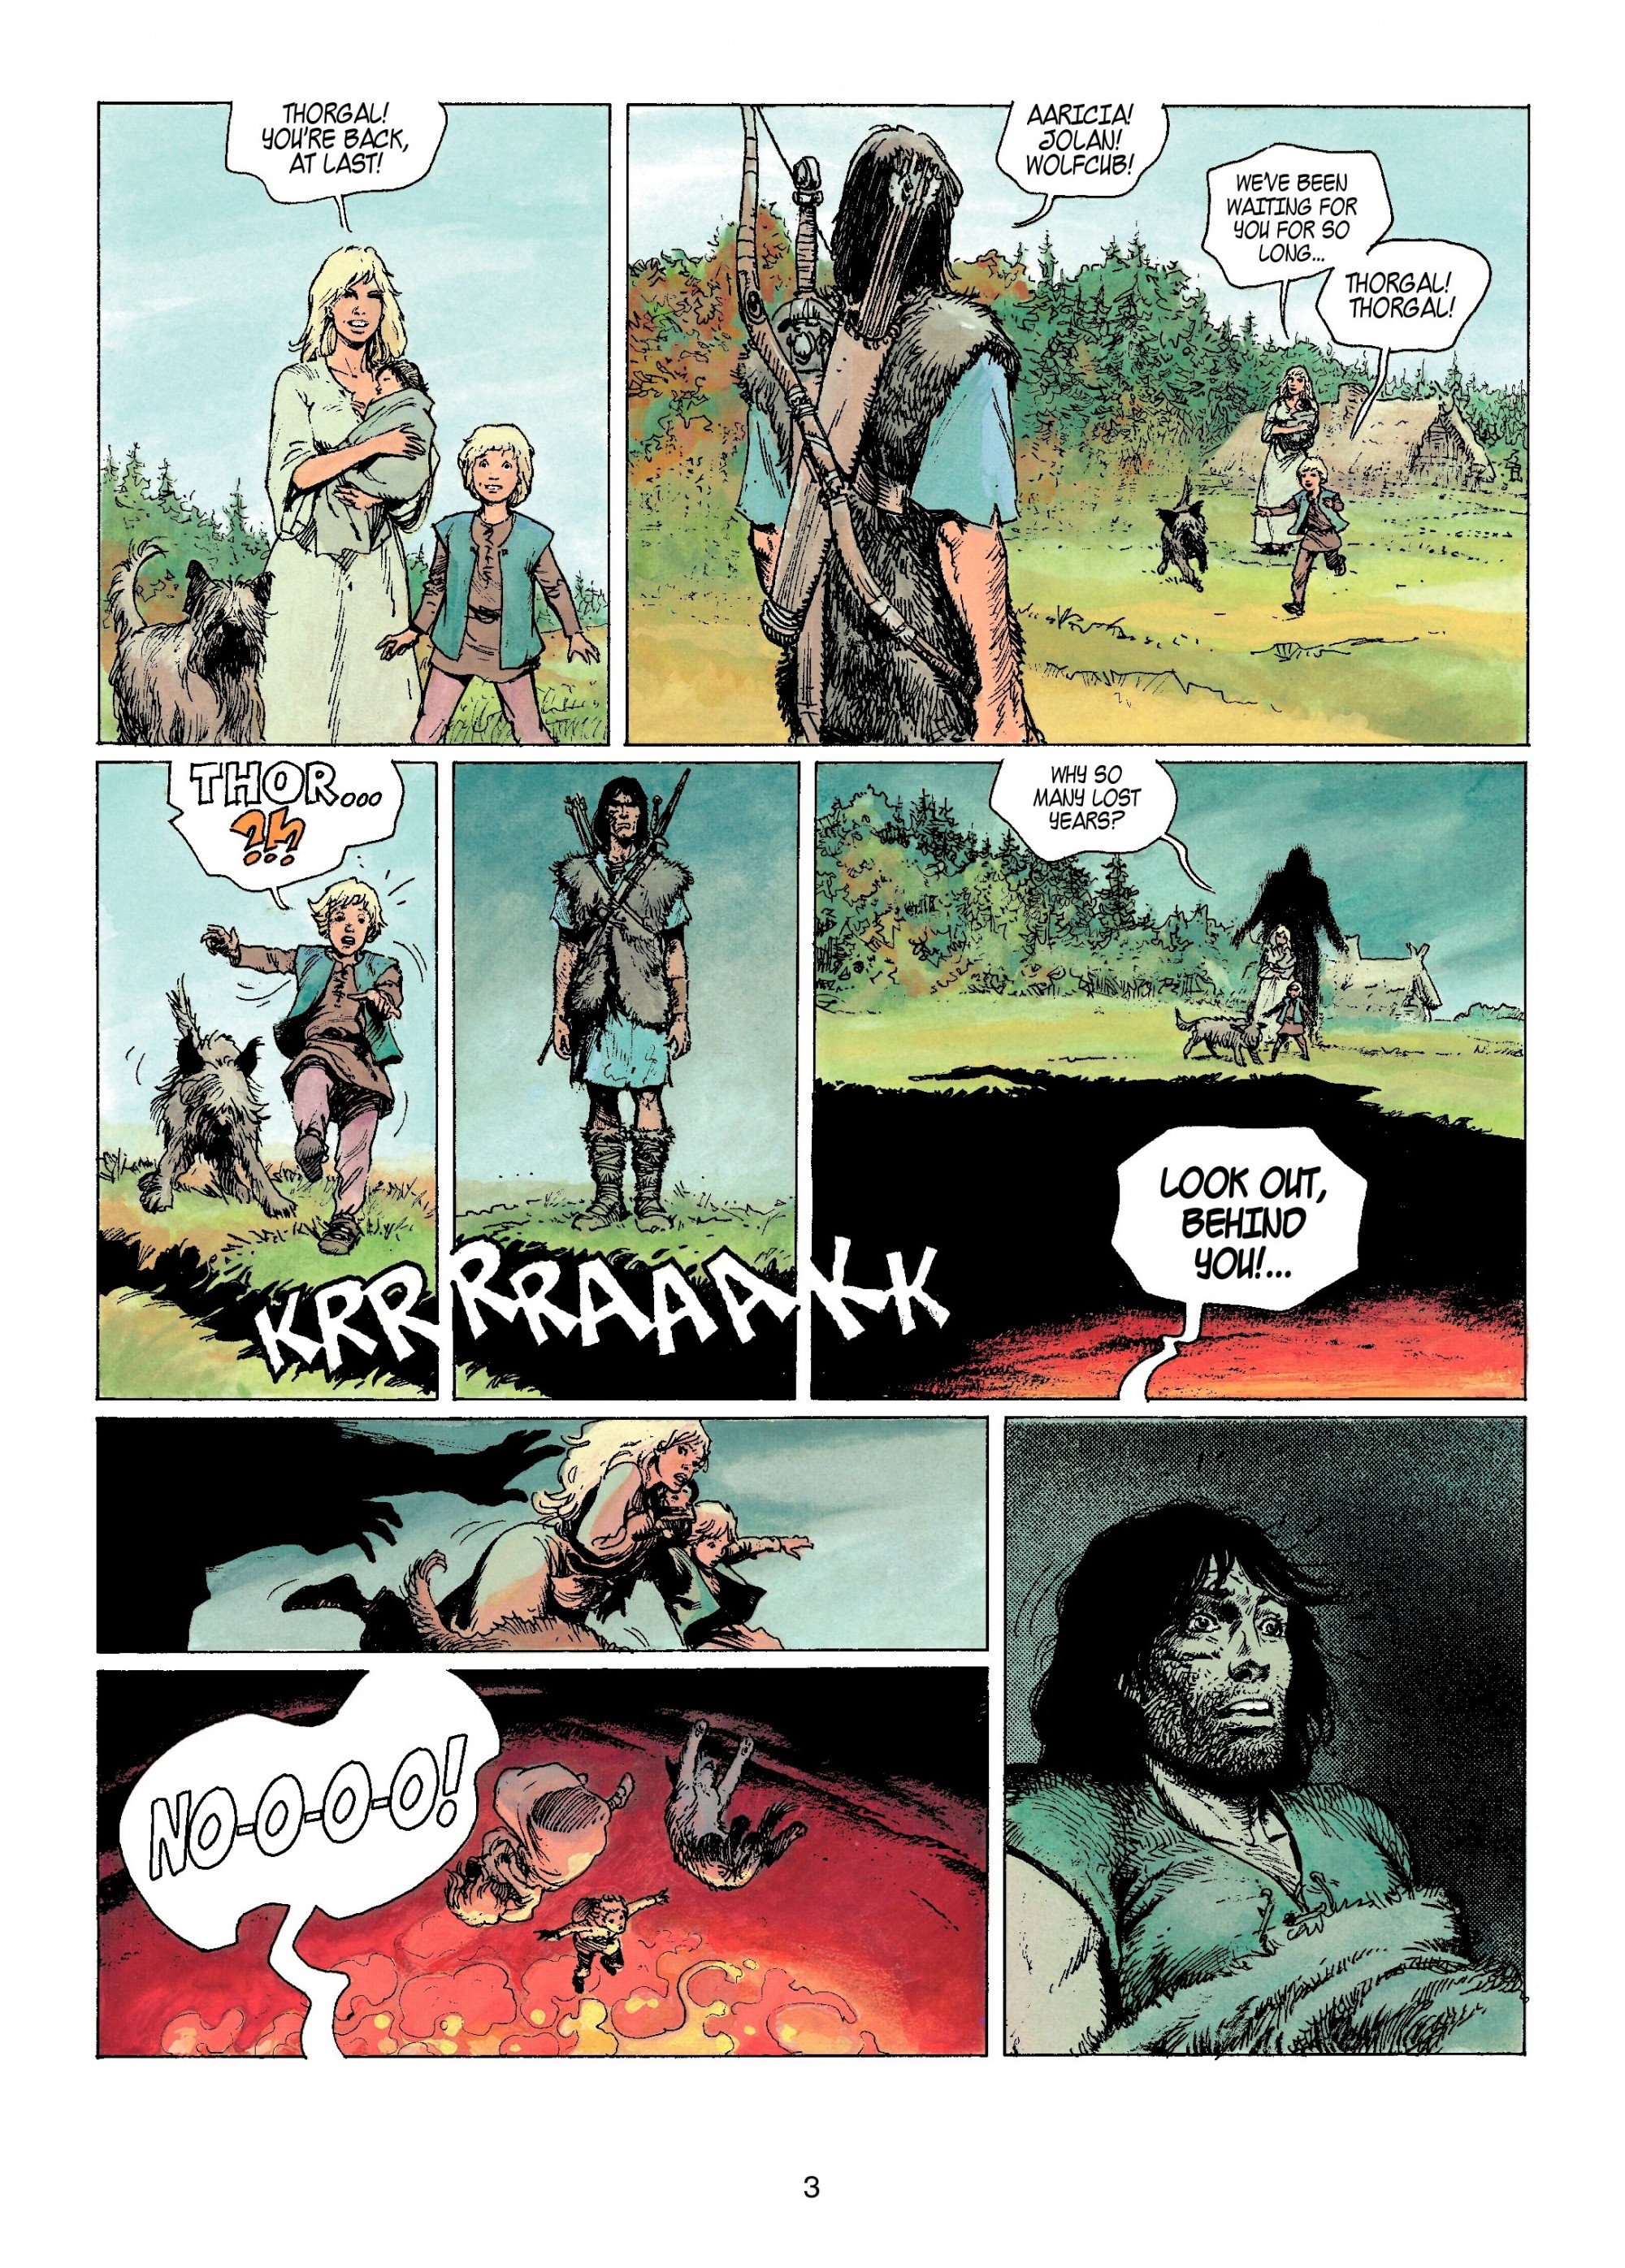
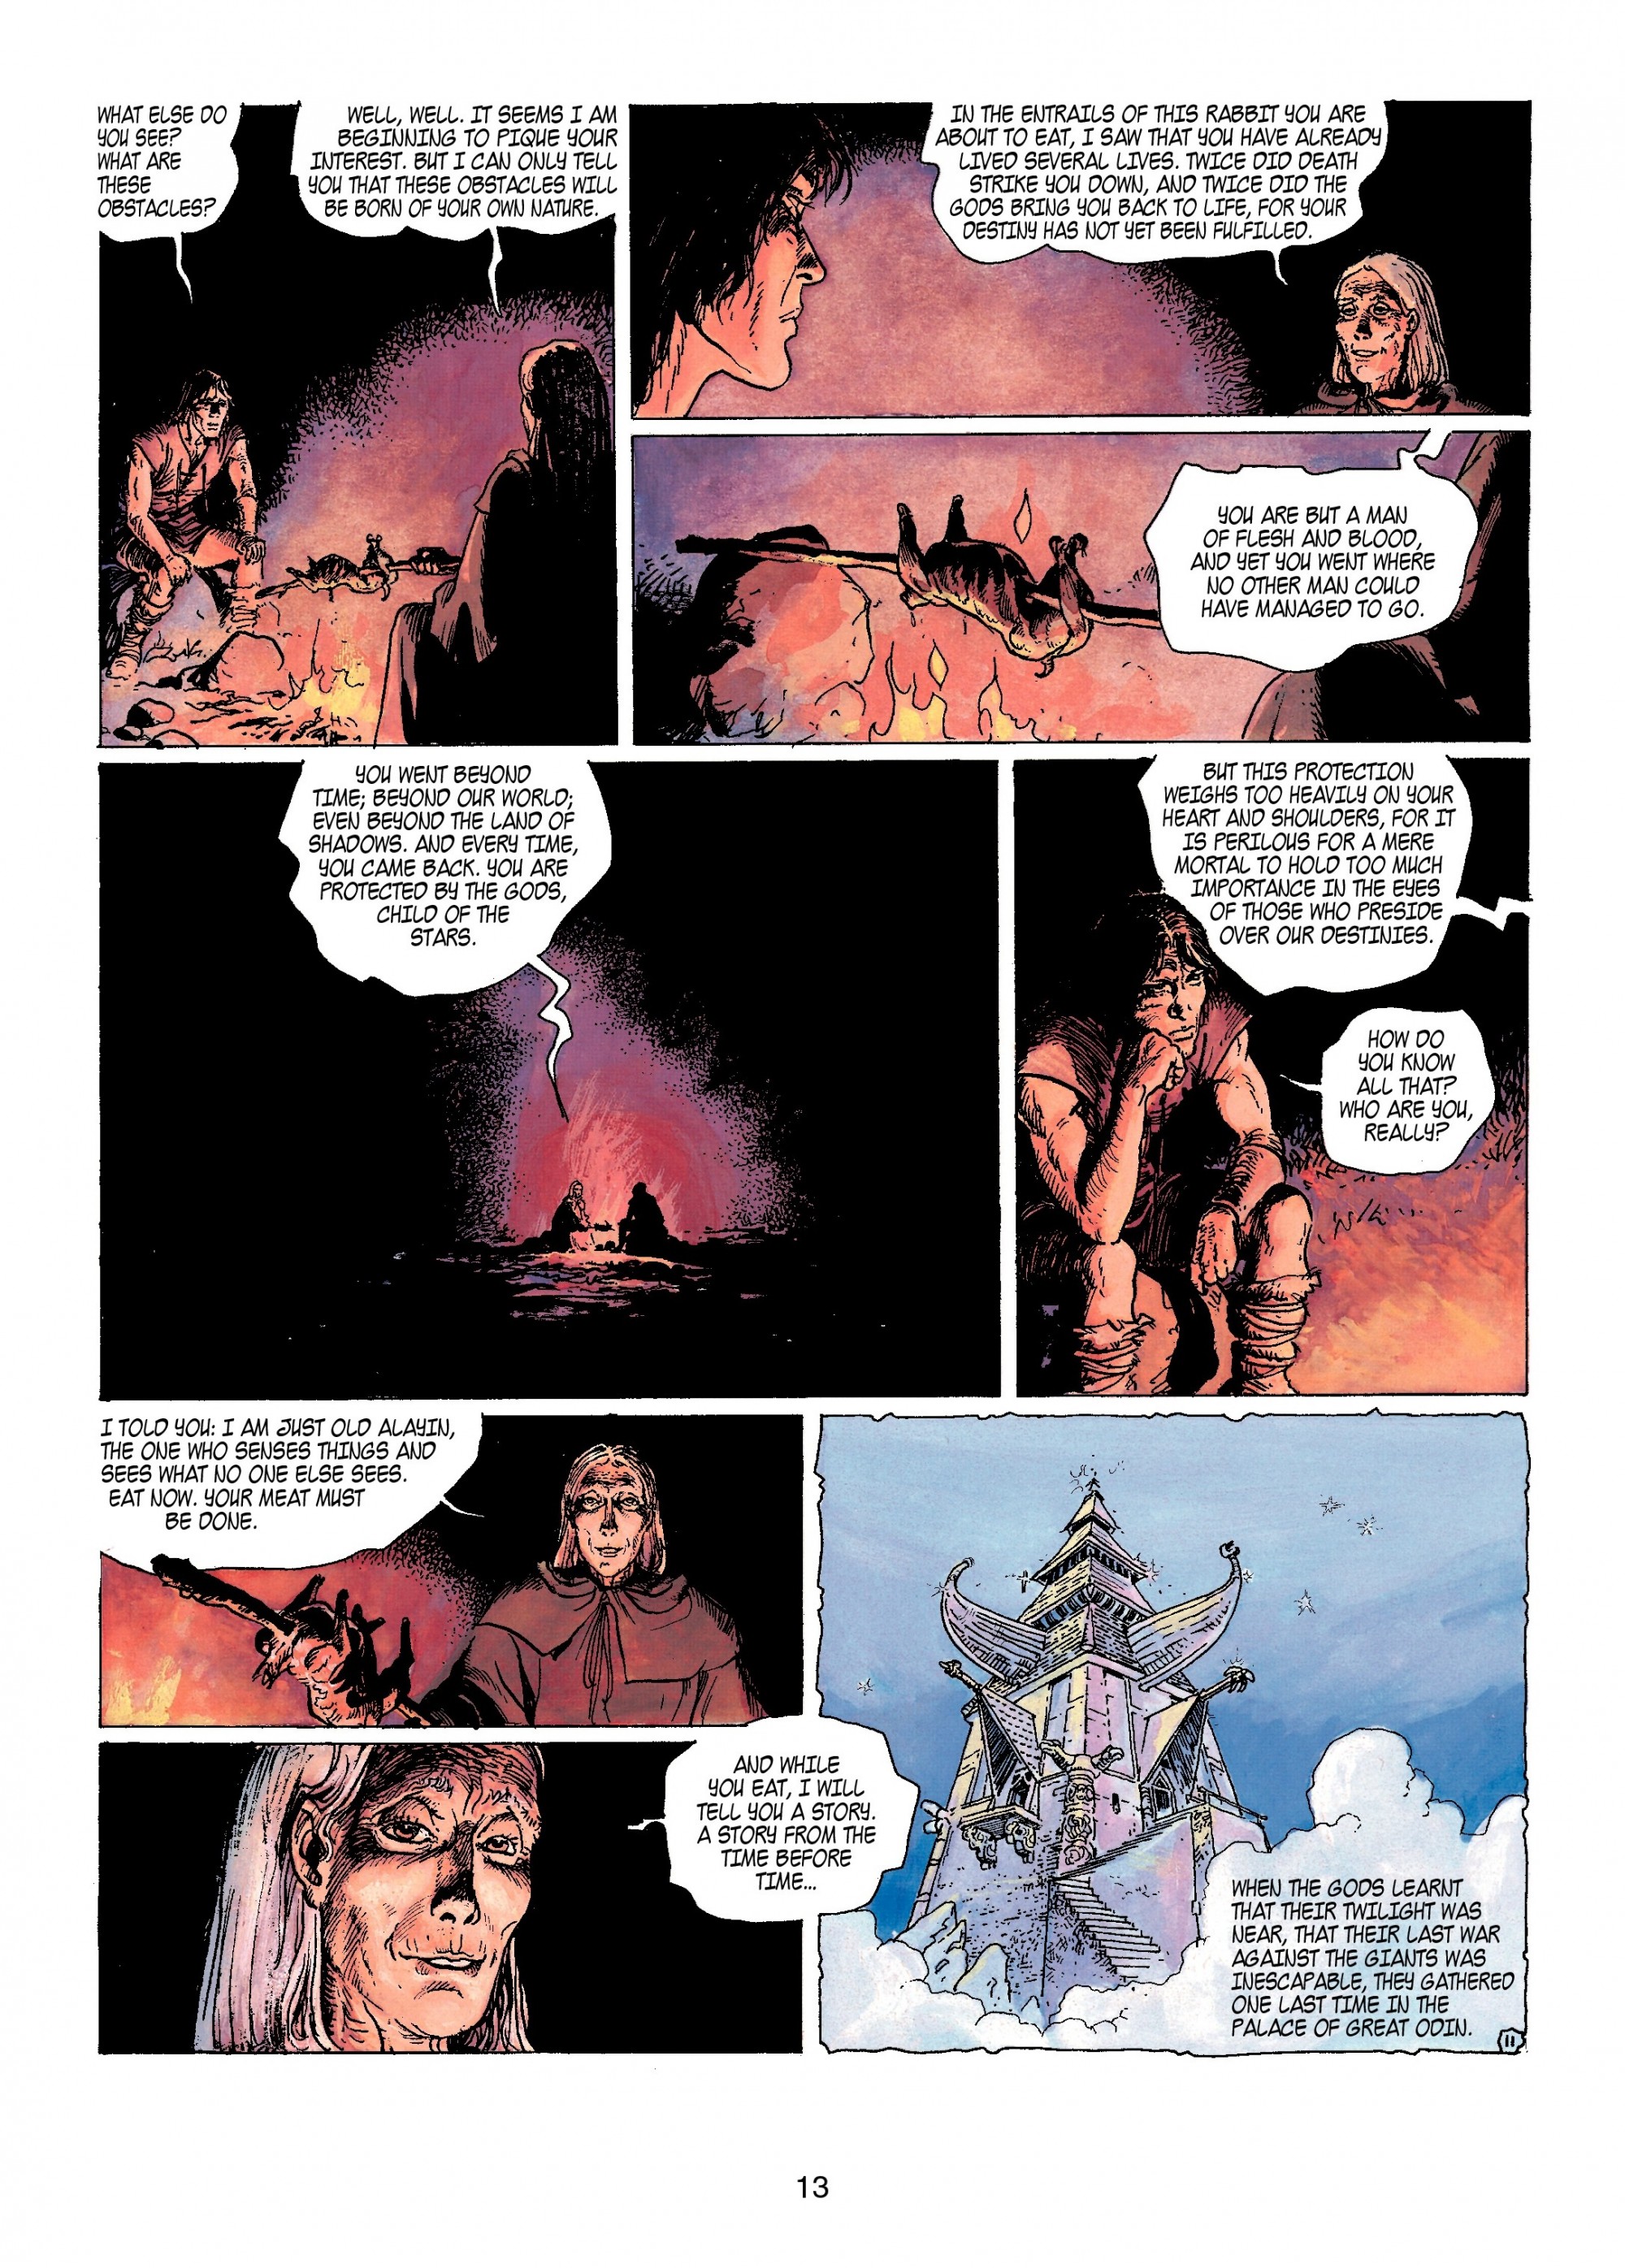
I’m taking as an example the first page of The Invisible Fortress, which is the 11th installment in the Thorgal series.
I don’t know what is the goût du jour, but I like using imageio for loading images. I use PIL for displaying them in a Jupyter notebook.
from PIL import Image
import imageio

im = imageio.imread('RCO003_1468214847.jpg')
Image.fromarray(im)
Canny edge detection
There are many ways to do image segmentation. It’s an entire field of research. In the present case, it seemed to me that I should make use of the fact that each panel has some sort of border around it. The background of the page is also always made up of a single tone of white.
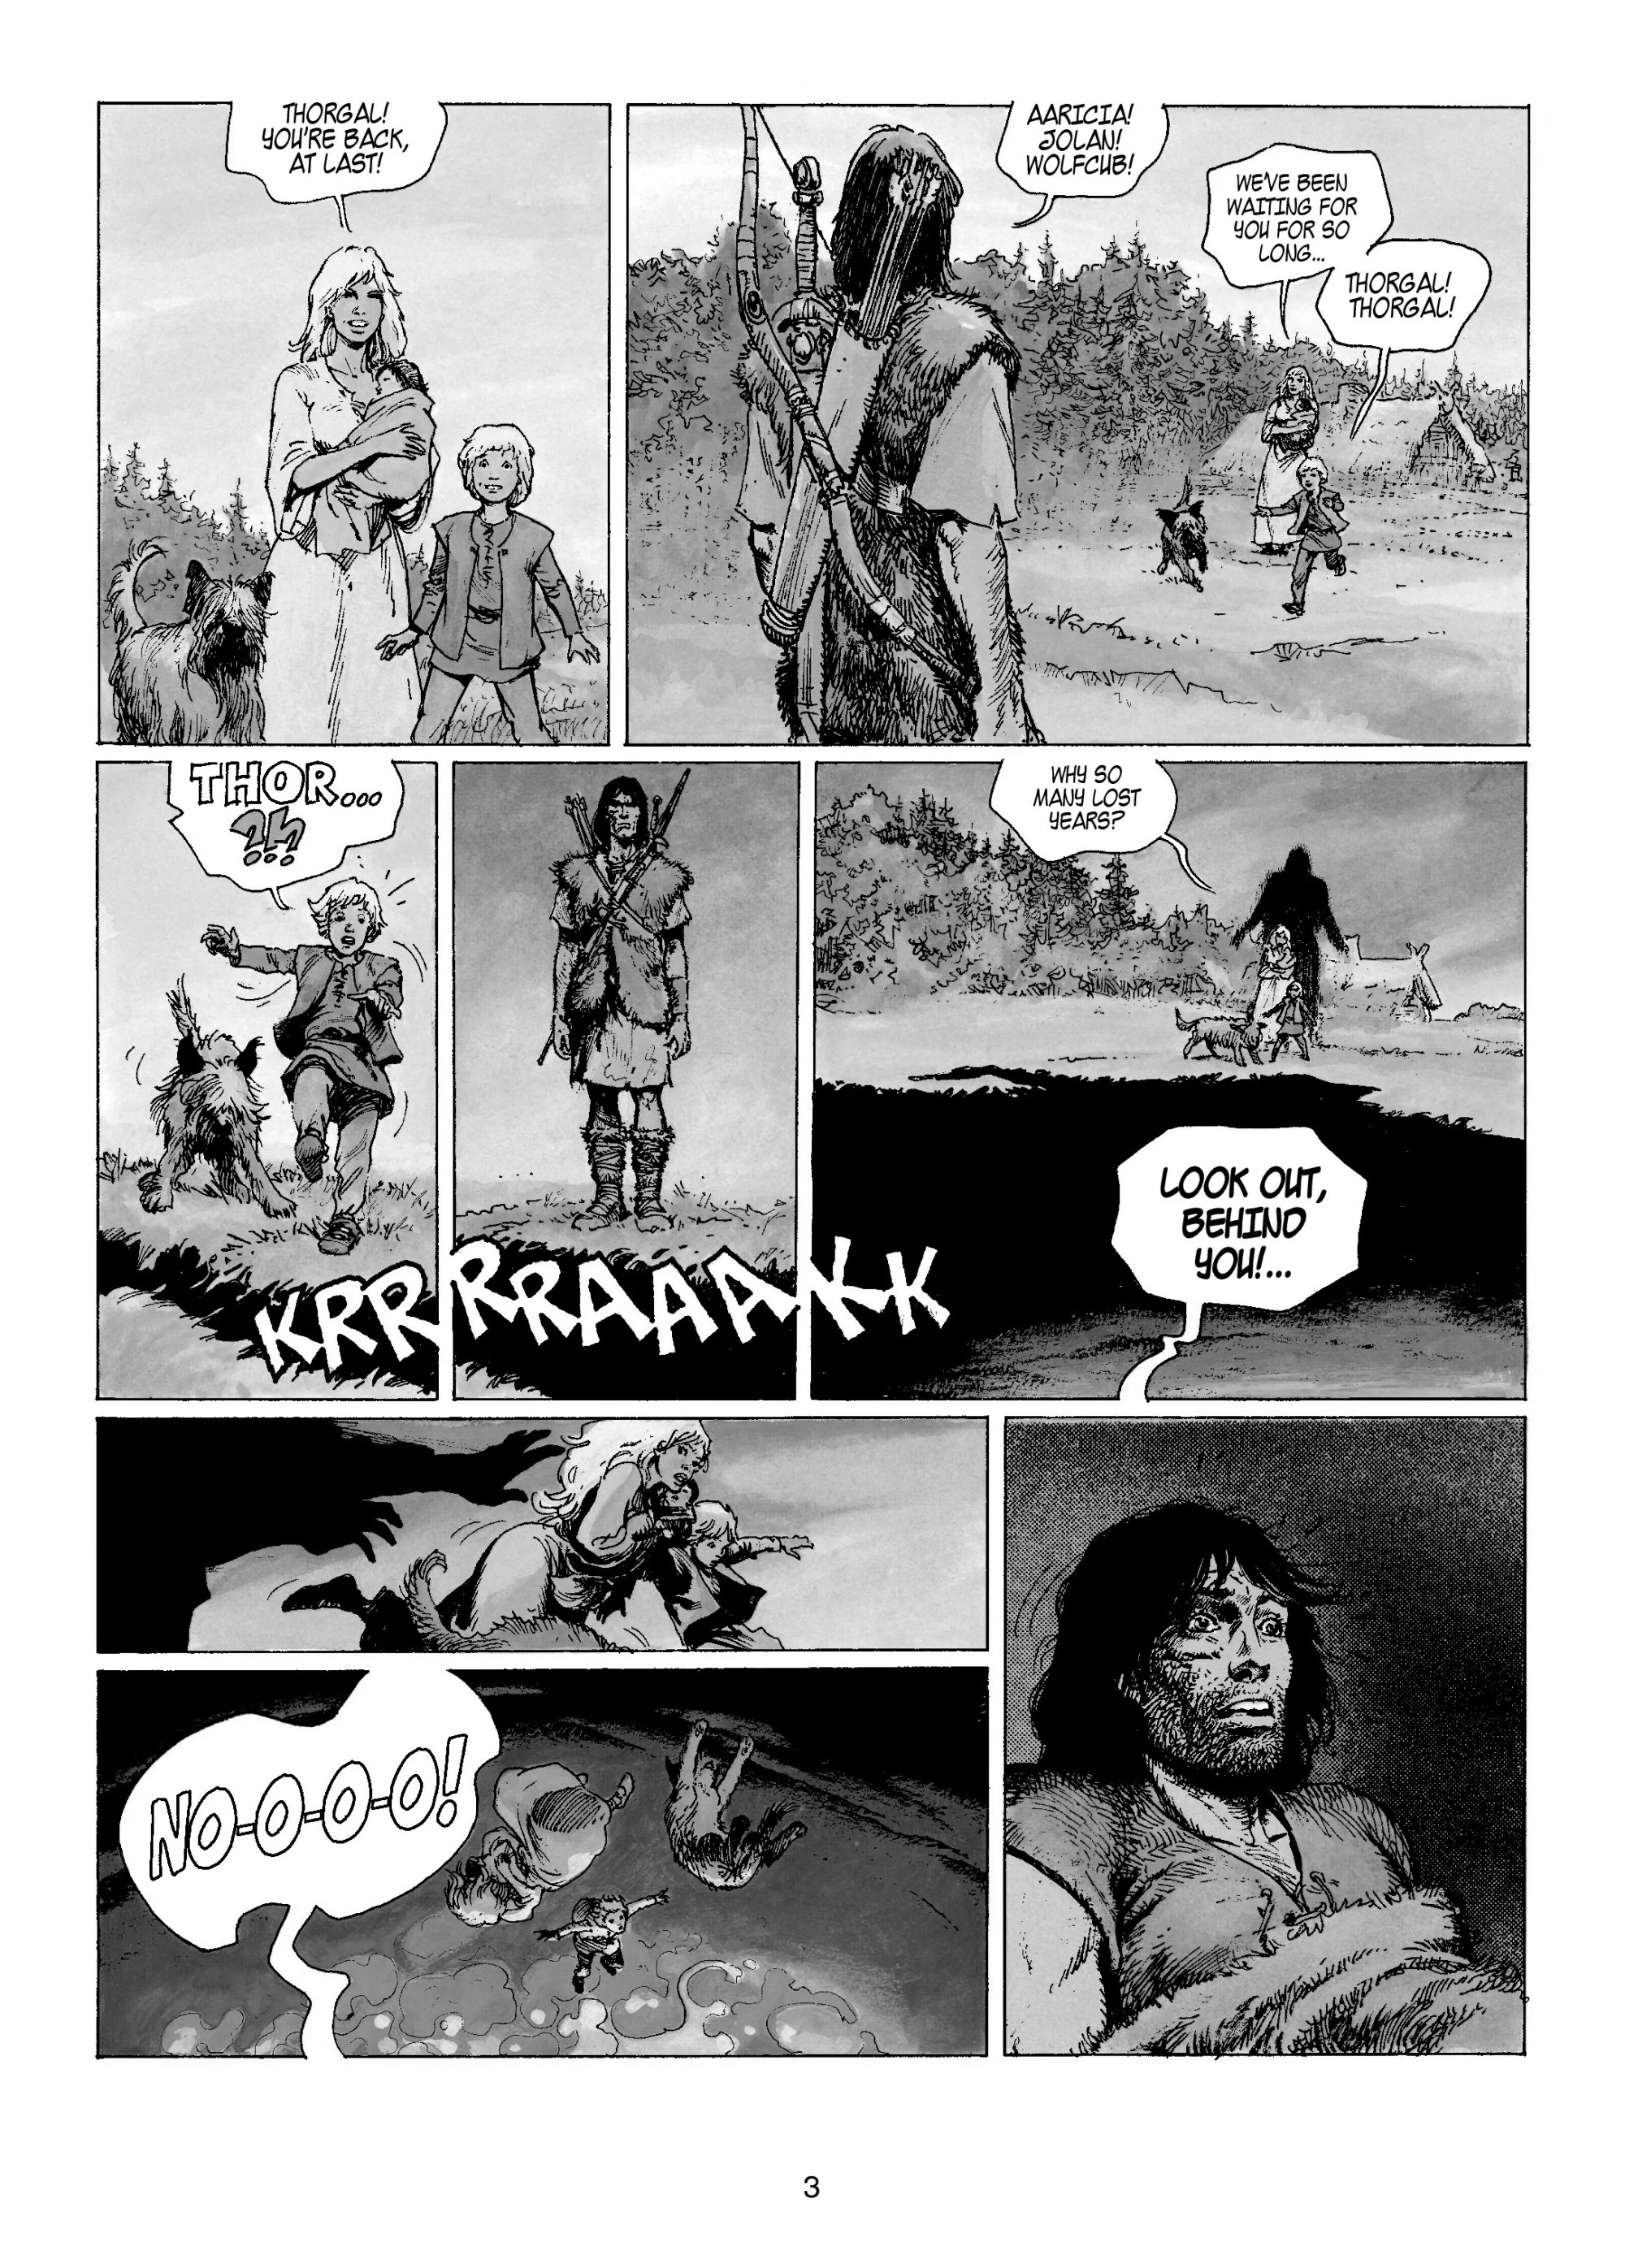
I did a bit of research and experimenting and settled on using a Canny edge detector. I have absolutely no clue how it works, but I had a feeling that looking for the edges of the panels was the way to go. This detector works on grayscale images, so I first did the conversion.
from skimage.color import rgb2gray

grayscale = rgb2gray(im)
Image.fromarray((grayscale * 255).astype('uint8'), 'L')
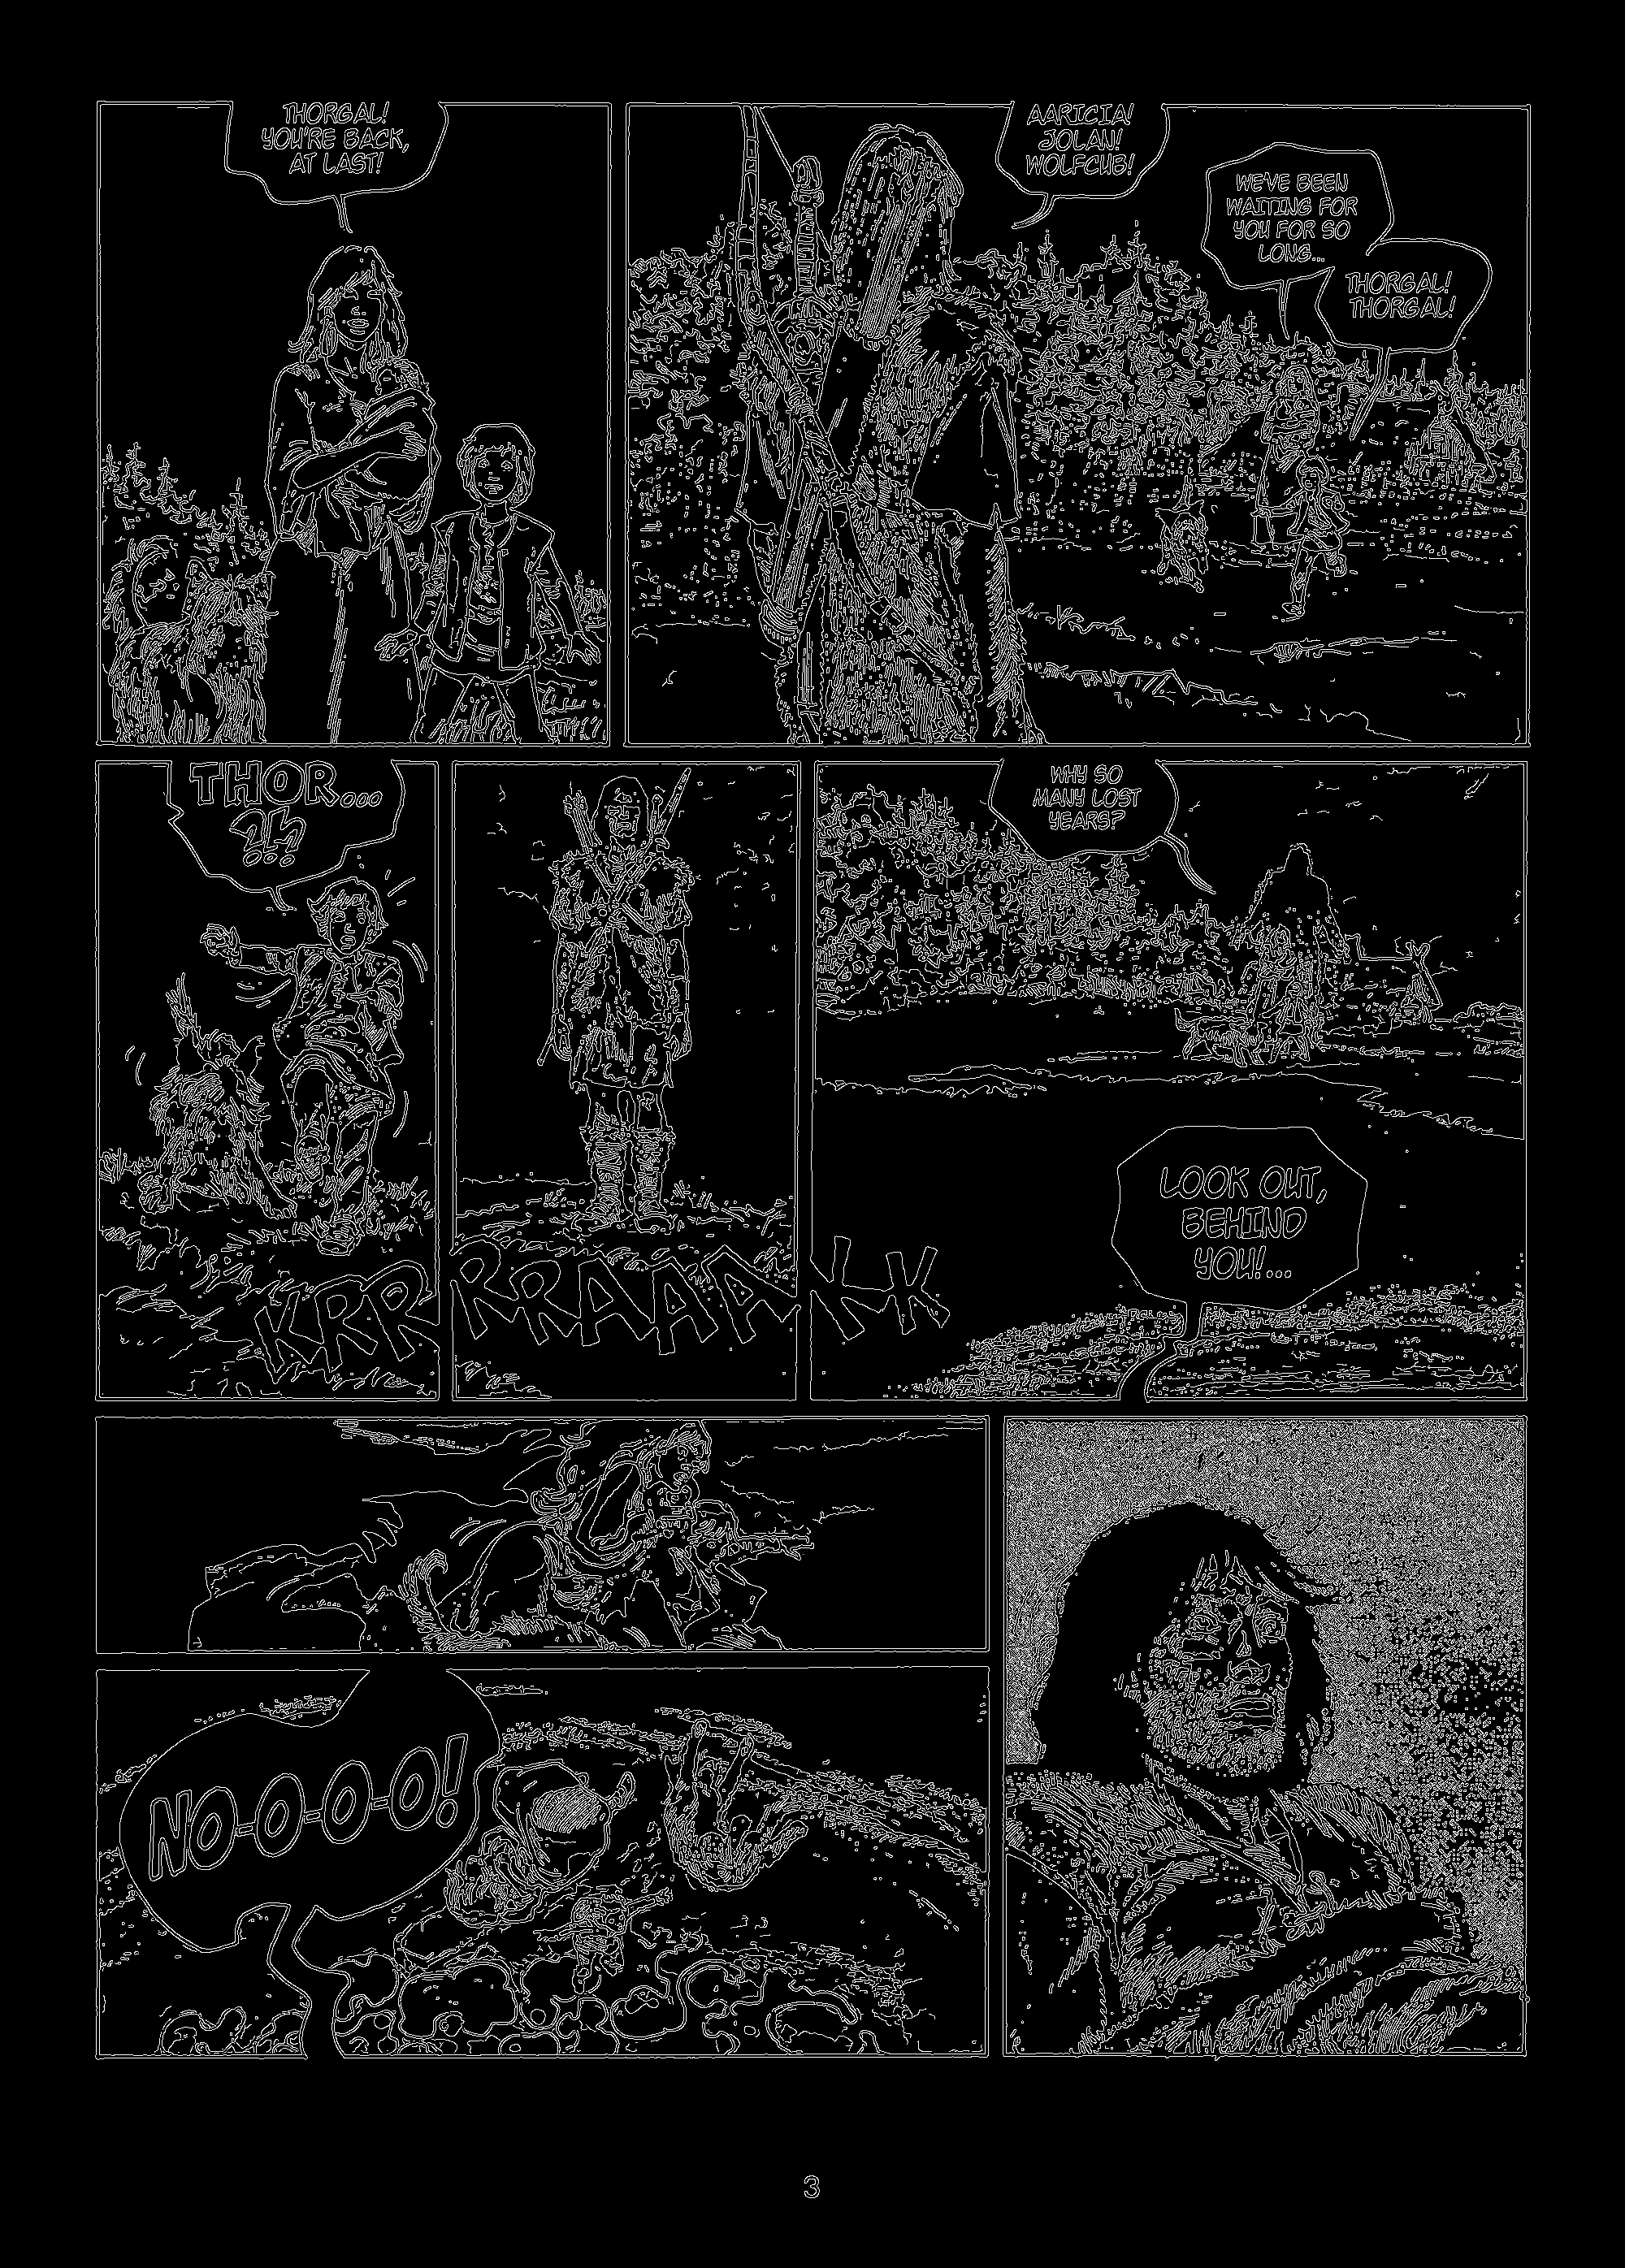
Applying a Canny edge detector is trivial with scikit-image.
from skimage.feature import canny

edges = canny(grayscale)
Image.fromarray(edges)
Edge thickening via dilation
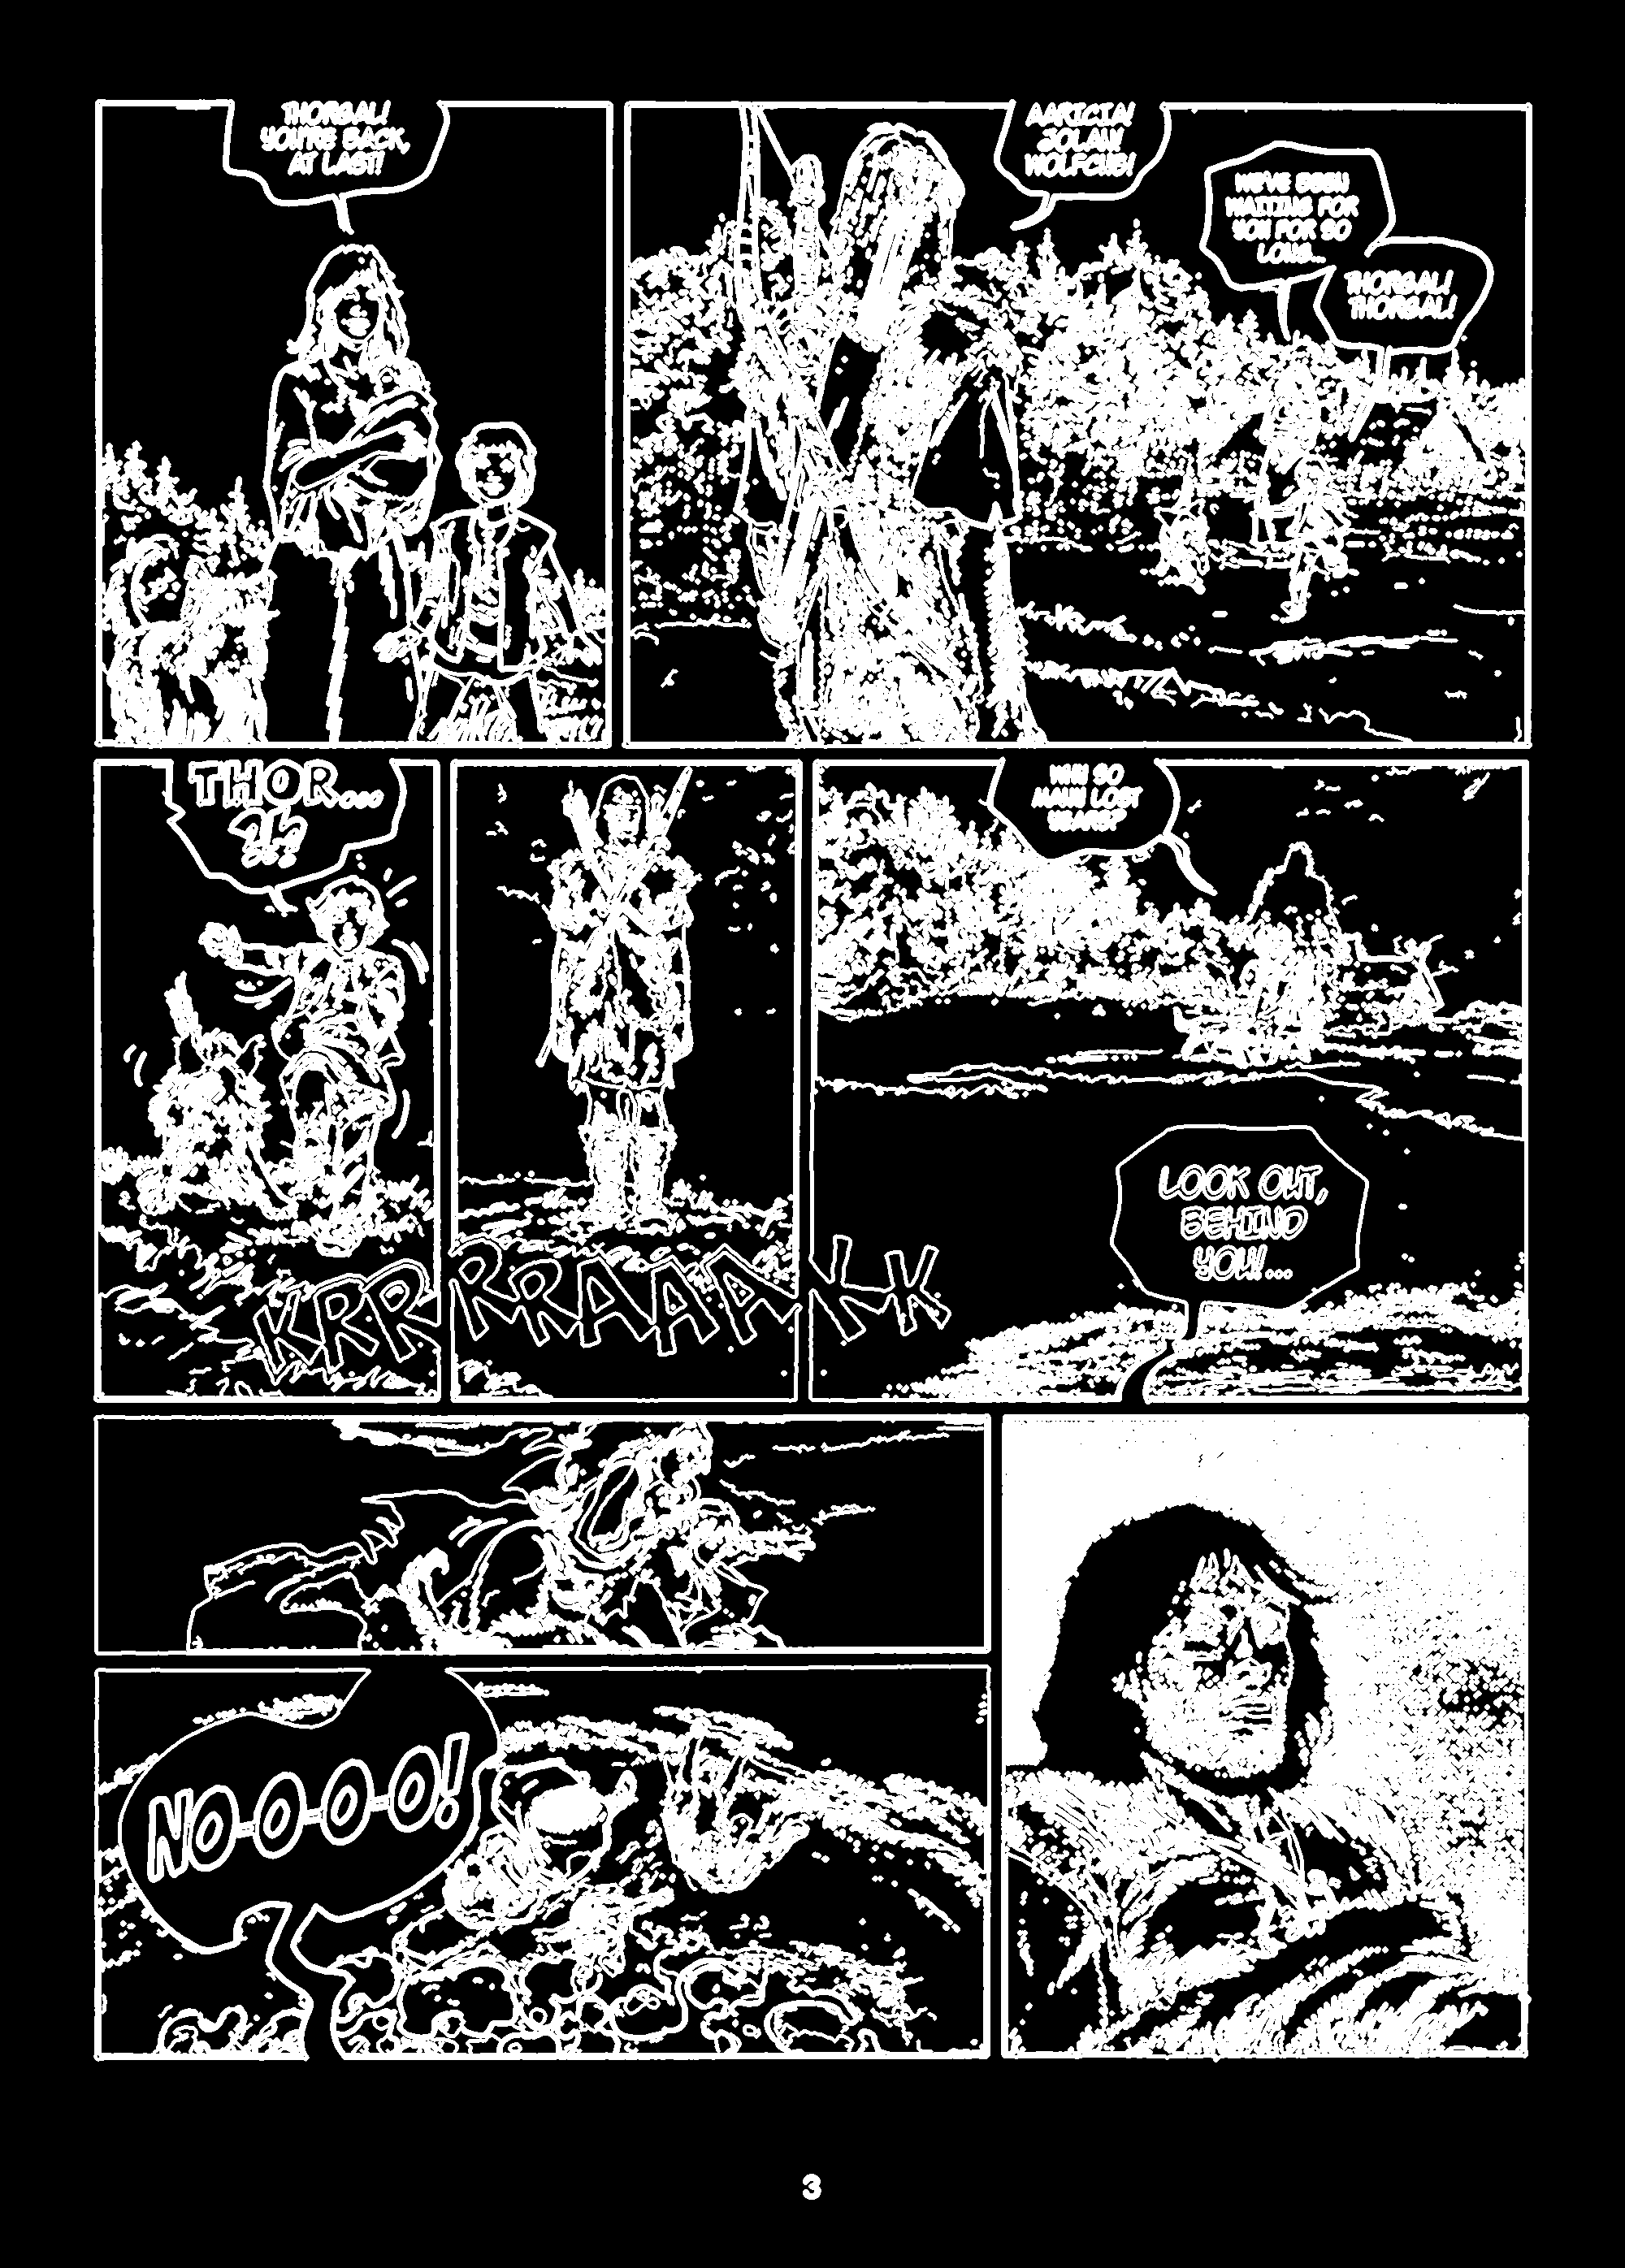
To make the segmentation process more robust, I decided to thicken the edges so that the lines along each panel’s border are contiguous. Indeed, these panel borders are sometimes a bit rough, so it’s possible that background pixels insert themselves. Thickening the output of the edge detector is a cheap way to make the ensuing segmentation process more robust. This can be done with a dilation operator.
from skimage.morphology import dilation

thick_edges = dilation(dilation(edges))
Image.fromarray(thick_edges)
Filling holes
There’s still a few steps to take to get to where we want. But the heavy lifting has been done by the Canny edge detector. Now it’s just a question of connecting the right parts of the image together.
First of all, I filled in all the black patches which are surrounded by white. This significantly reduces the number of contiguous patches of white pixels.
from scipy import ndimage as ndi

segmentation = ndi.binary_fill_holes(thick_edges)
Image.fromarray(segmentation)
With hindsight, I don’t think this step is essential. But it feels right, and probably saves up some computation for the next steps.
Labelling each patch
The next step is to label each white patch. Again, this is really easy to do thanks to scikit-image. There’s even a nifty label2rgb function to help visualize the patches.
from skimage.measure import label
from skimage.color import label2rgb

labels = label(segmentation)

Image.fromarray(np.uint8(label2rgb(labels, bg_label=0) * 255))
Regrouping patches into panels
Up to here, I’ve essentially been using scikit-image’s out-of-the-box features. But the next step is a bit more involved. Essentially, my goal is to regroup the patches, so that patches which belong to the same panel are merged with each other. I didn’t find any out-of-the-box way to do this, so I wrote my own logic.
from skimage.measure import regionprops

def do_bboxes_overlap(a, b):
    return (
        a[0] < b[2] and
        a[2] > b[0] and
        a[1] < b[3] and
        a[3] > b[1]
    )

def merge_bboxes(a, b):
    return (
        min(a[0], b[0]),
        min(a[1], b[1]),
        max(a[2], b[2]),
        max(a[3], b[3])
    )

regions = regionprops(labels)
panels = []

for region in regions:

    for i, panel in enumerate(panels):
        if do_bboxes_overlap(region.bbox, panel):
            panels[i] = merge_bboxes(panel, region.bbox)
            break
    else:
        panels.append(region.bbox)
The regionprops function is handy, as it transforms a labelled image into a list of image regions. These provide a bbox attribute, which is the bounding box encompassing a patch.
In a nutshell, the above logic is a clustering algorithm, whereby regions that have overlapping bounding boxes are merged. I found this great animation which makes clear the logic for determining whether or not two rectangles overlap each other.
Afterwards, I did a little post-processing step to remove small panels. Indeed, if you look at the image above, the page number “3” is a separate region. And sometimes some printing artifacts may appear on a comic book page. I simply removed bounding boxes which are smaller than 1% of the image area.
for i, bbox in reversed(list(enumerate(panels))):
    area = (bbox[2] - bbox[0]) * (bbox[3] - bbox[1])
    if area < 0.01 * im.shape[0] * im.shape[1]:
        del panels[i]
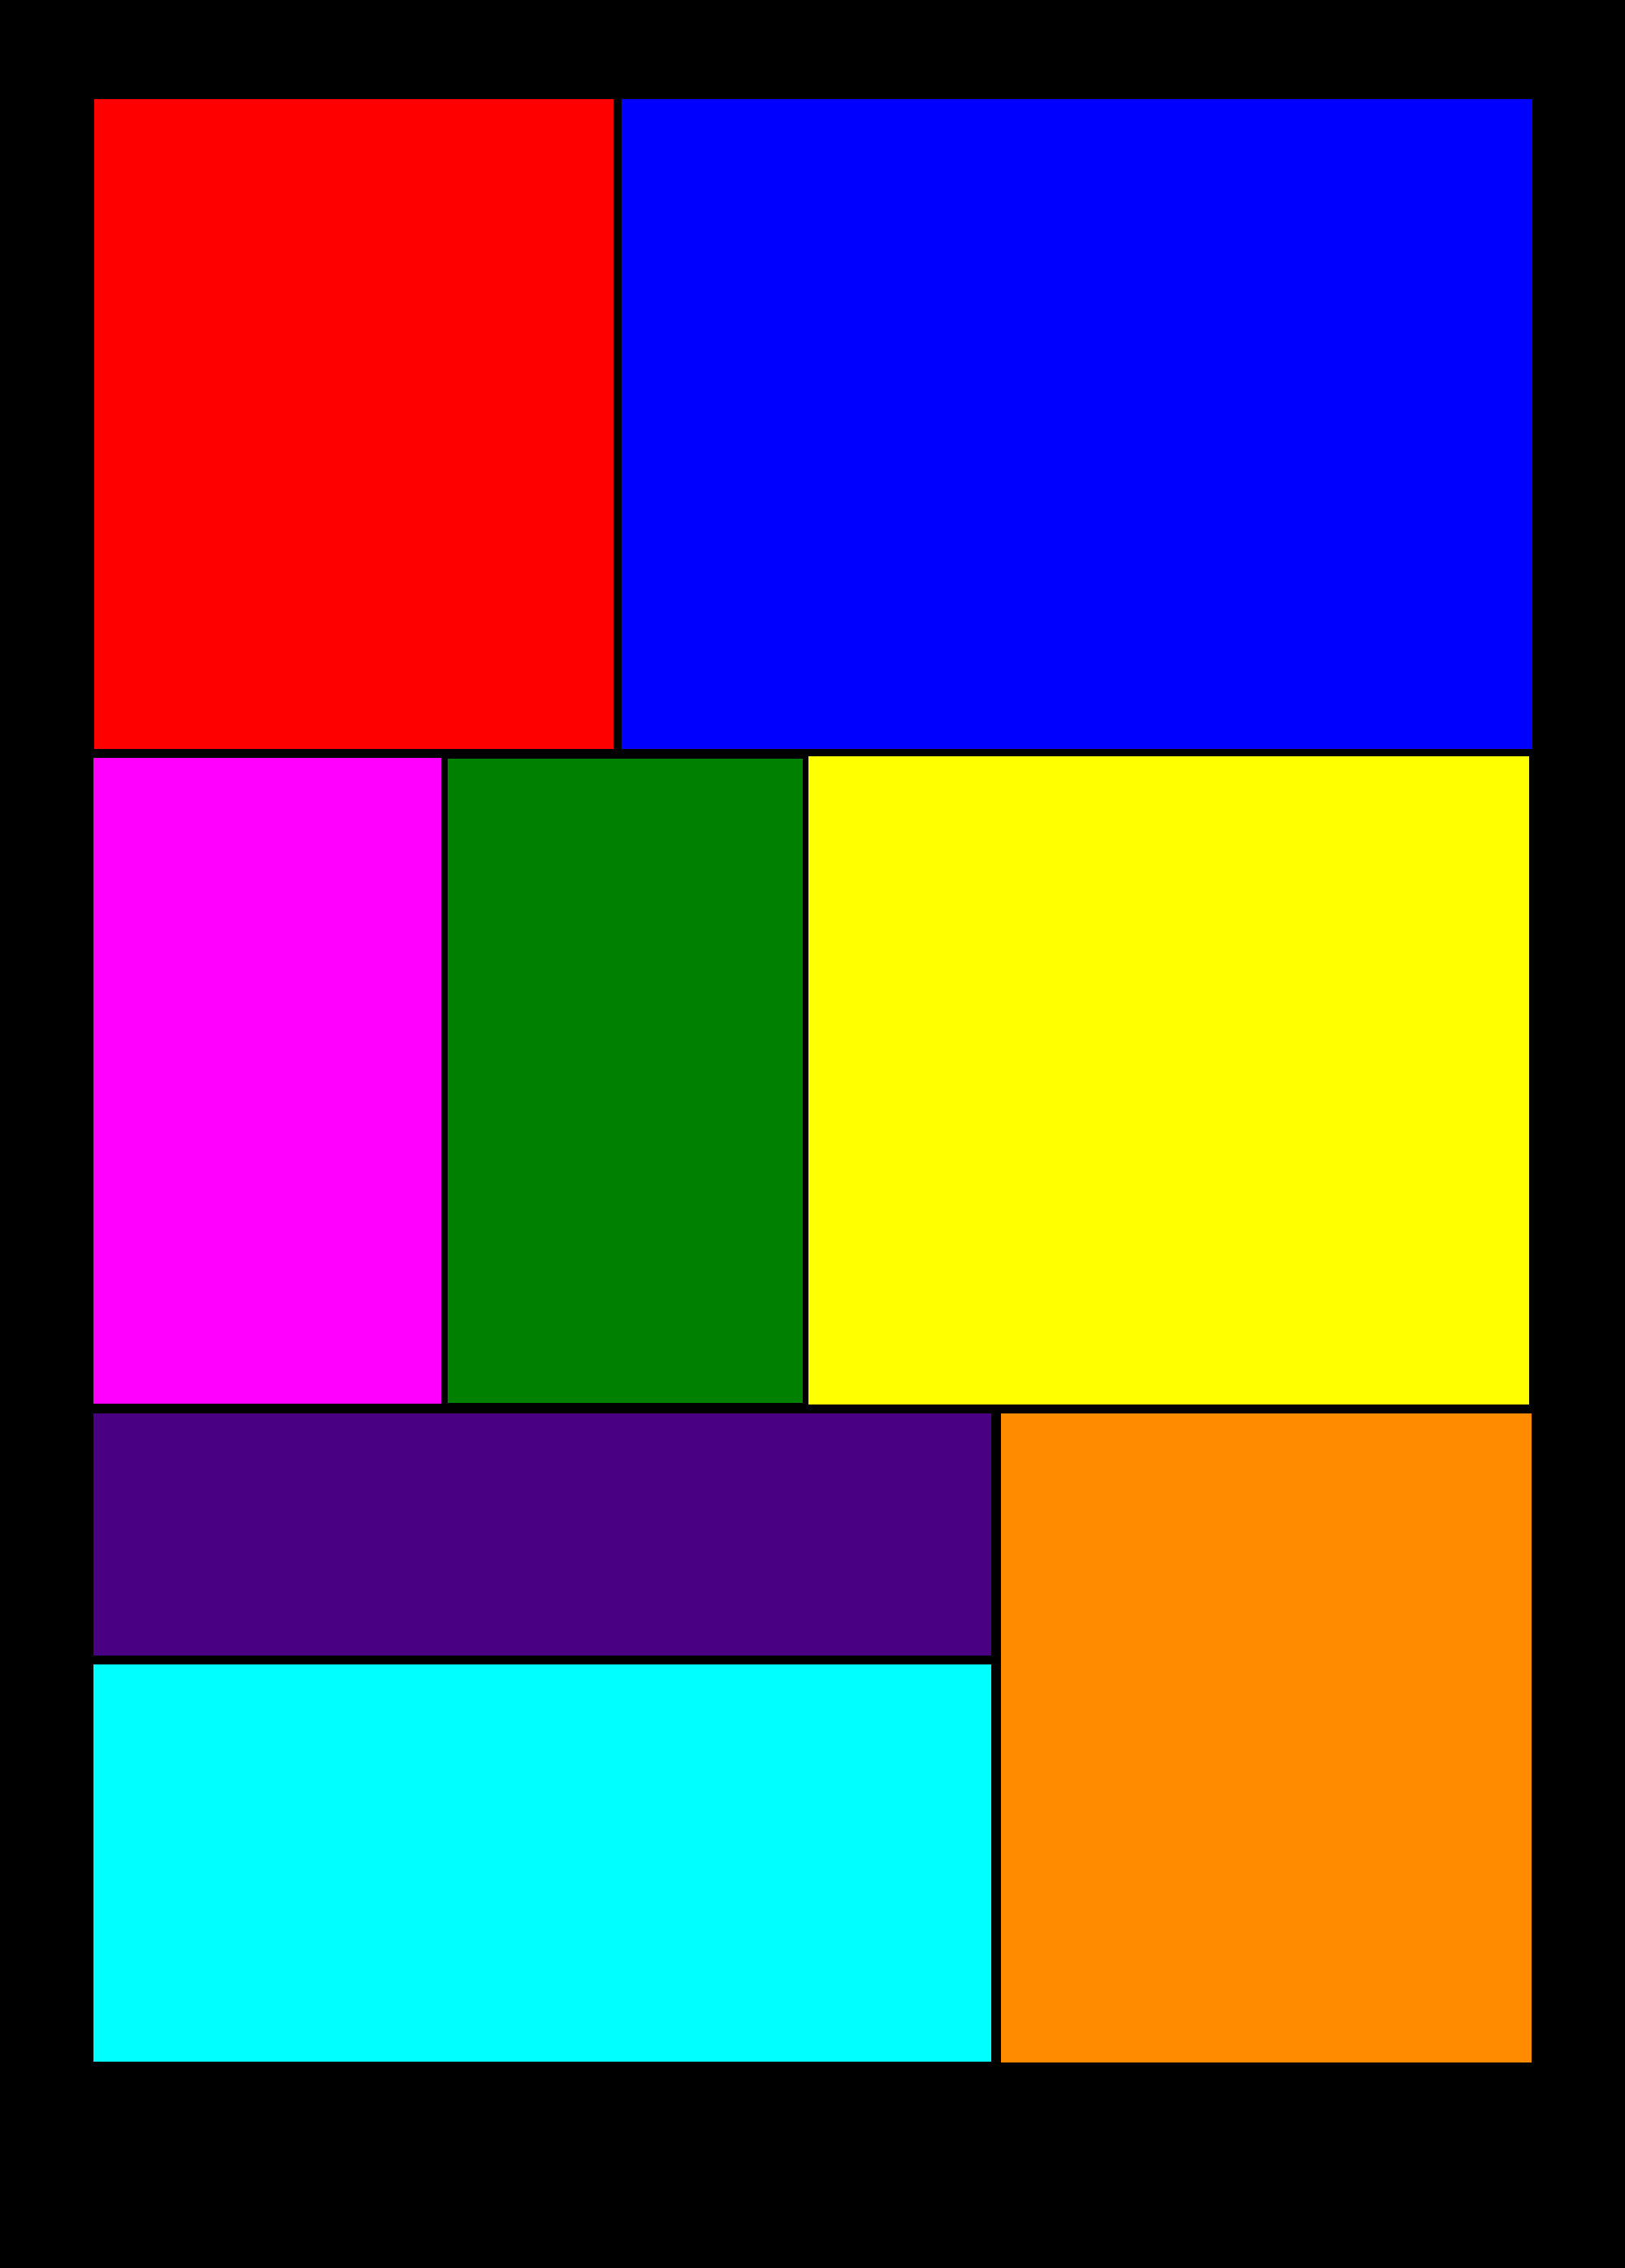
Here’s a bit of code to visualize each panel.
panel_img = np.zeros_like(labels)

for i, bbox in enumerate(panels, start=1):
    panel_img[bbox[0]:bbox[2], bbox[1]:bbox[3]] = i

Image.fromarray(label2rgb(panel_img, bg_label=0) * 255).astype('uint8'))
Ordering the panels
The last step is to order the panels in the correct order. Indeed, we’ve managed to segment the page into separate panels, but the panels aren’t ordered in the order they should be read.
This is a bit trickier than I thought it would be. We could split panels by row, but a row may also contain a column, as is the case with the final row. I ended up writing a recursive function that clusters panels together if they share a vertical or horizontal coordinate. I flip between vertical and horizontal each time the function recurses. It might help to think of this as a function that is “drilling down” the page.
def are_bboxes_aligned(a, b, axis):
    return (
        a[0 + axis] < b[2 + axis] and
        b[0 + axis] < a[2 + axis]
    )

def cluster_bboxes(bboxes, axis=0):

    clusters = []

    # Regroup bboxes which overlap along the current axis.
    # For instance, two panels on the same row overlap
    # along their verticial coordinate.
    for bbox in bboxes:
        for cluster in clusters:
            if any(
                are_bboxes_aligned(b, bbox, axis=axis)
                for b in cluster
            ):
                cluster.append(bbox)
                break
        else:
            clusters.append([bbox])

    # We want rows to be ordered from top to bottom, and
    # columns to be ordered from left to right.
    clusters.sort(key=lambda c: c[0][0 + axis])

    # For each row, we want to cluster the panels of that
    # row into columns, etc. etc.
    for i, cluster in enumerate(clusters):
        if len(cluster) > 1:
            clusters[i] = cluster_bboxes(
                bboxes=cluster,
                axis=1 if axis == 0 else 0
            )

    return clusters

clusters = cluster_bboxes(panels)
The clusters variable is now an arbitrarily nested list of bounding boxes.
>>> clusters
[[[(122, 116, 922, 755)], [(122, 765, 922, 1886)]],
 [[(933, 115, 1728, 543)], [(934, 551, 1727, 988)], [(931, 995, 1729, 1882)]],
 [[[(1740, 115, 2038, 1220)], [(2049, 115, 2538, 1220)]],
  [(1740, 1232, 2539, 1885)]]]
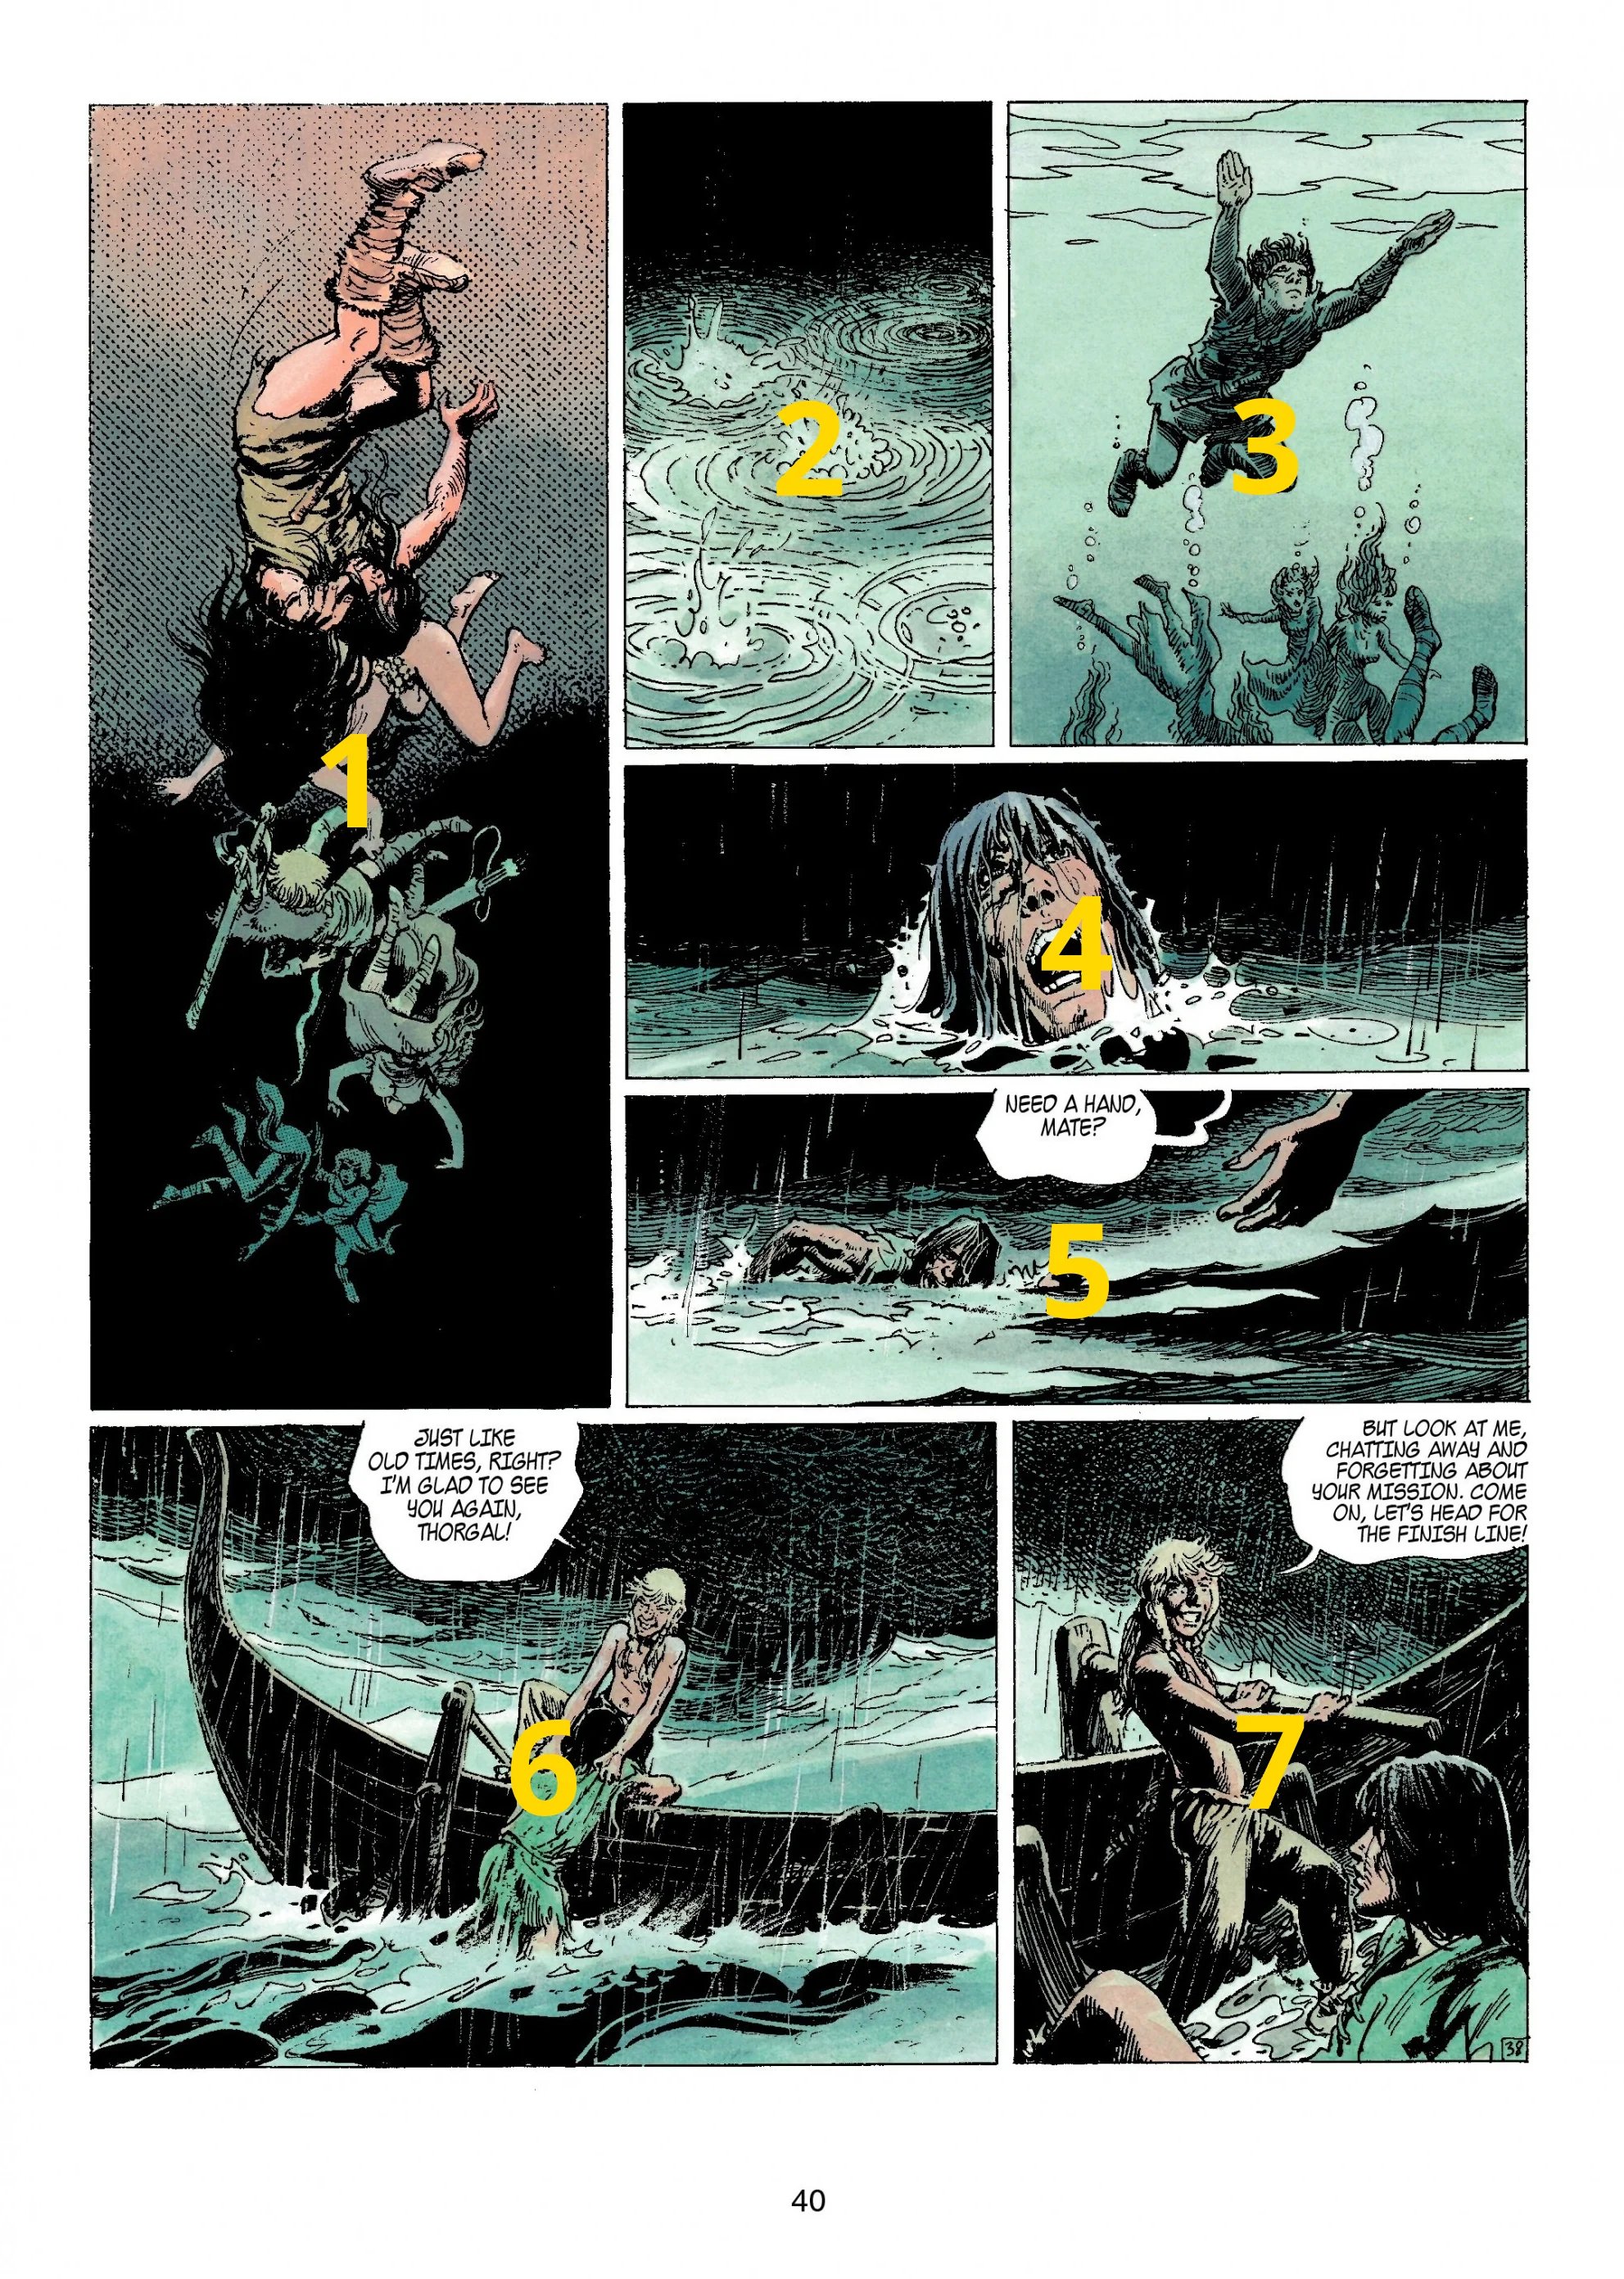
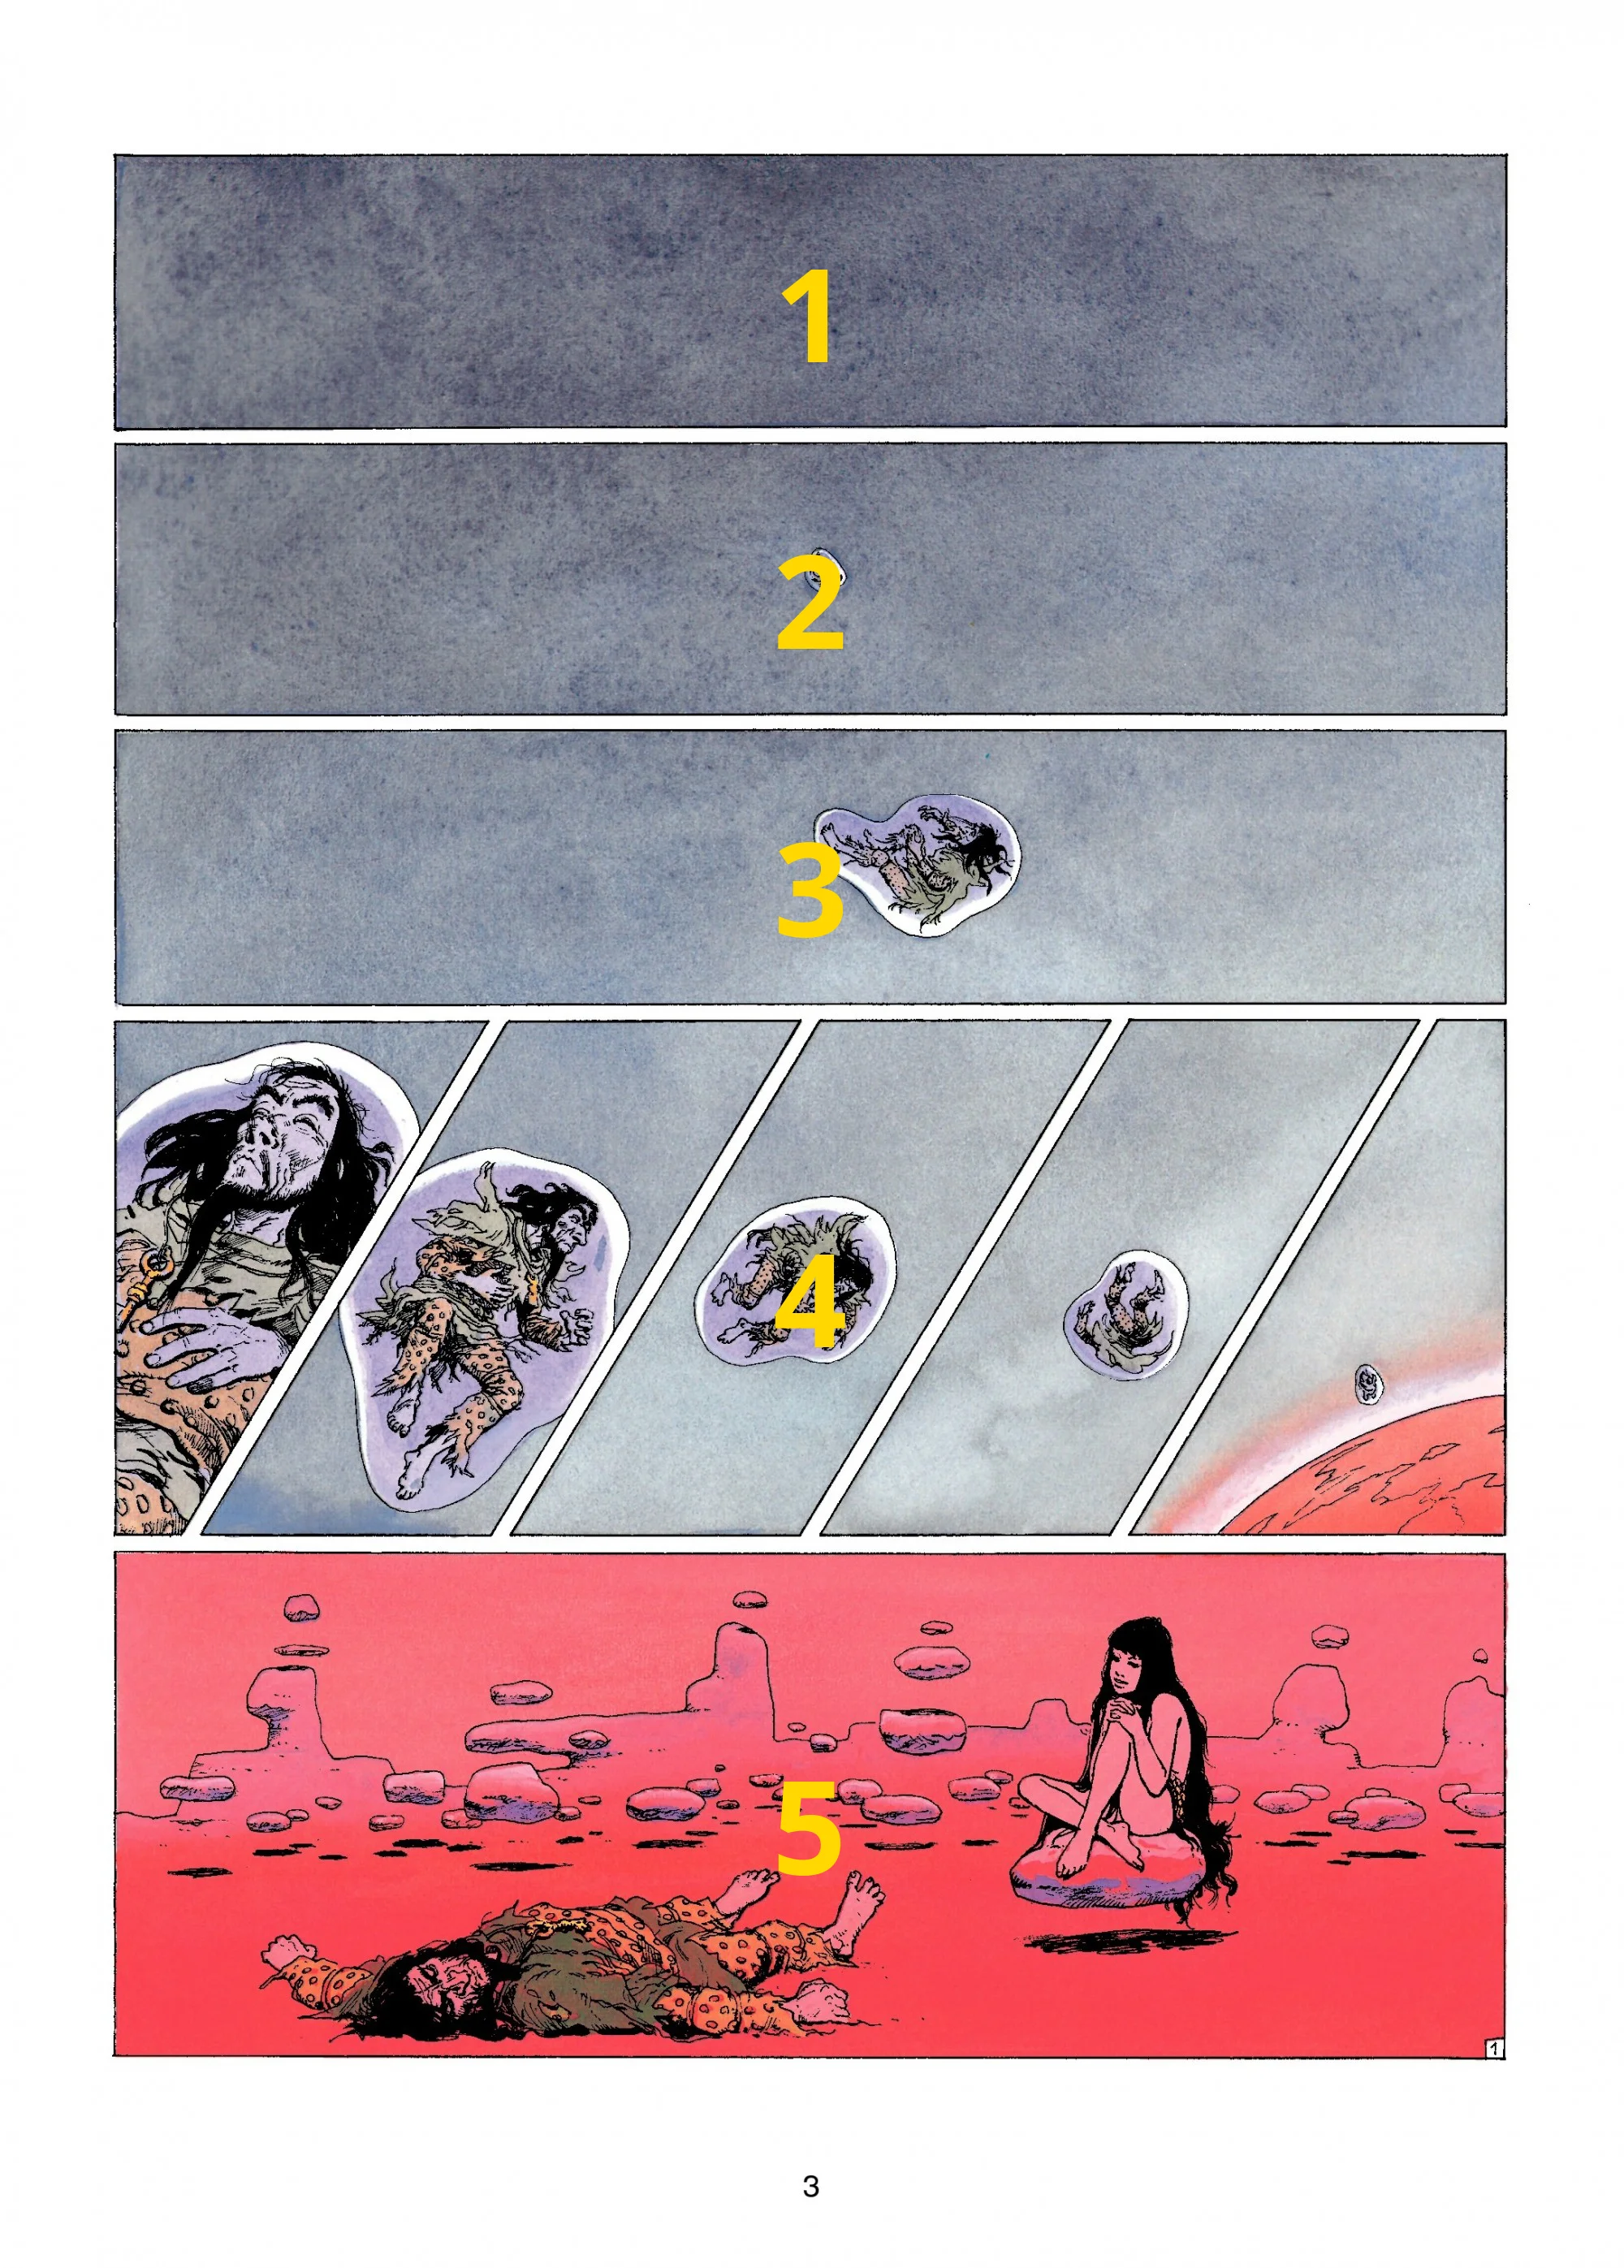
I wrote some code to flatten it, so that we can loop over the bounding boxes in the order they’re supposed to be looked at by the reader. Then for the purpose of debugging, I wrote a digit on each panel to verify the resulting order.
from PIL import ImageFont
from PIL import ImageDraw

img = Image.fromarray(im)
draw = ImageDraw.Draw(img)
font = ImageFont.truetype('OpenSans-Bold.ttf', 160)

def flatten(l):
    for el in l:
        if isinstance(el, list):
            yield from flatten(el)
        else:
            yield el

for i, bbox in enumerate(flatten(clusters), start=1):
    w, h = draw.textsize(str(i), font=font)
    x = (bbox[1] + bbox[3] - w) / 2
    y = (bbox[0] + bbox[2] - h) / 2
    draw.text((x, y), str(i), (255, 215, 0), font=font)

img
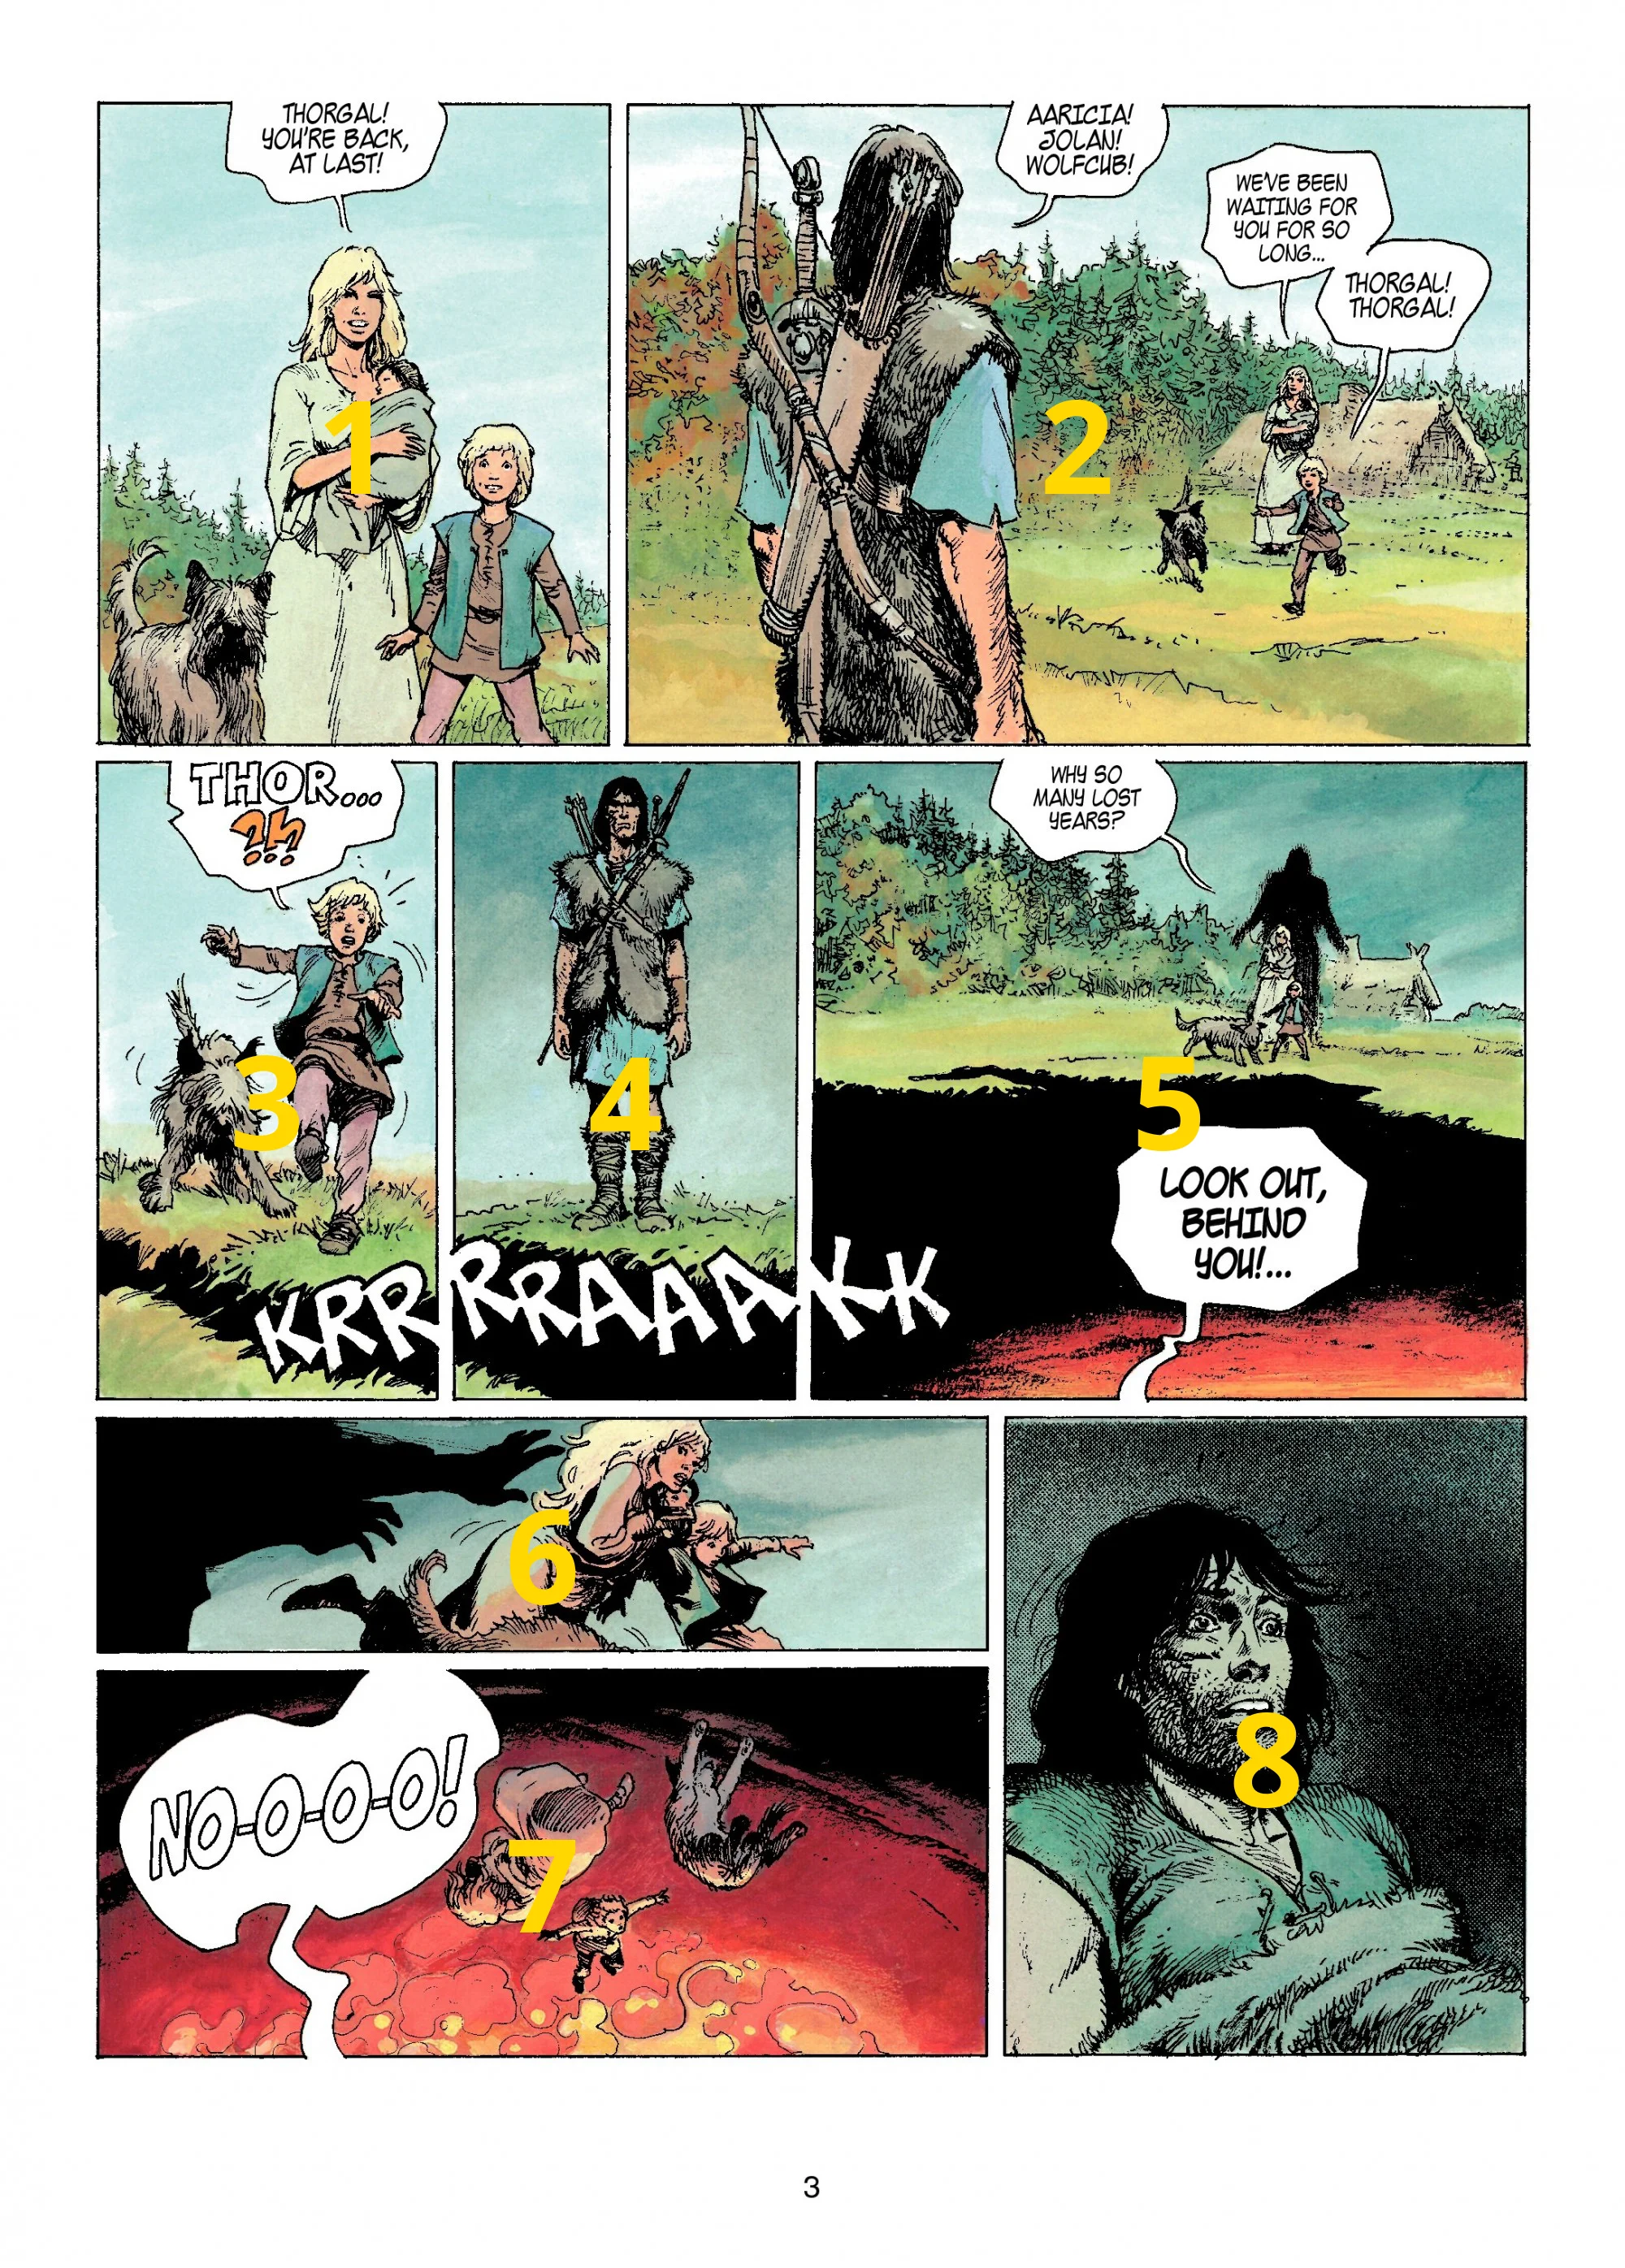
There we go, that’s correct. If we wanted to, we could now save each panel as a separate image, as so:
import os

os.makedirs('panels', exists_ok=True)

for i, bbox in enumerate(flatten(clusters)):
    panel = im[bbox[0]:bbox[2], bbox[1]:bbox[3]]
    Image.fromarray(panel).save(f'panels/{i}.png')
Edge cases
I determined which steps to perform by working with a single example. Obviously, there is no guarantee this process will work for any given comic strip page. Here is a harder example where the process is successful:
This example is a tad harder because of the nesting of the panels. Indeed, the second and third panel are part of a row, which is itself part of a column, which is part of a row. But the recursive clustering function handles this rather well.
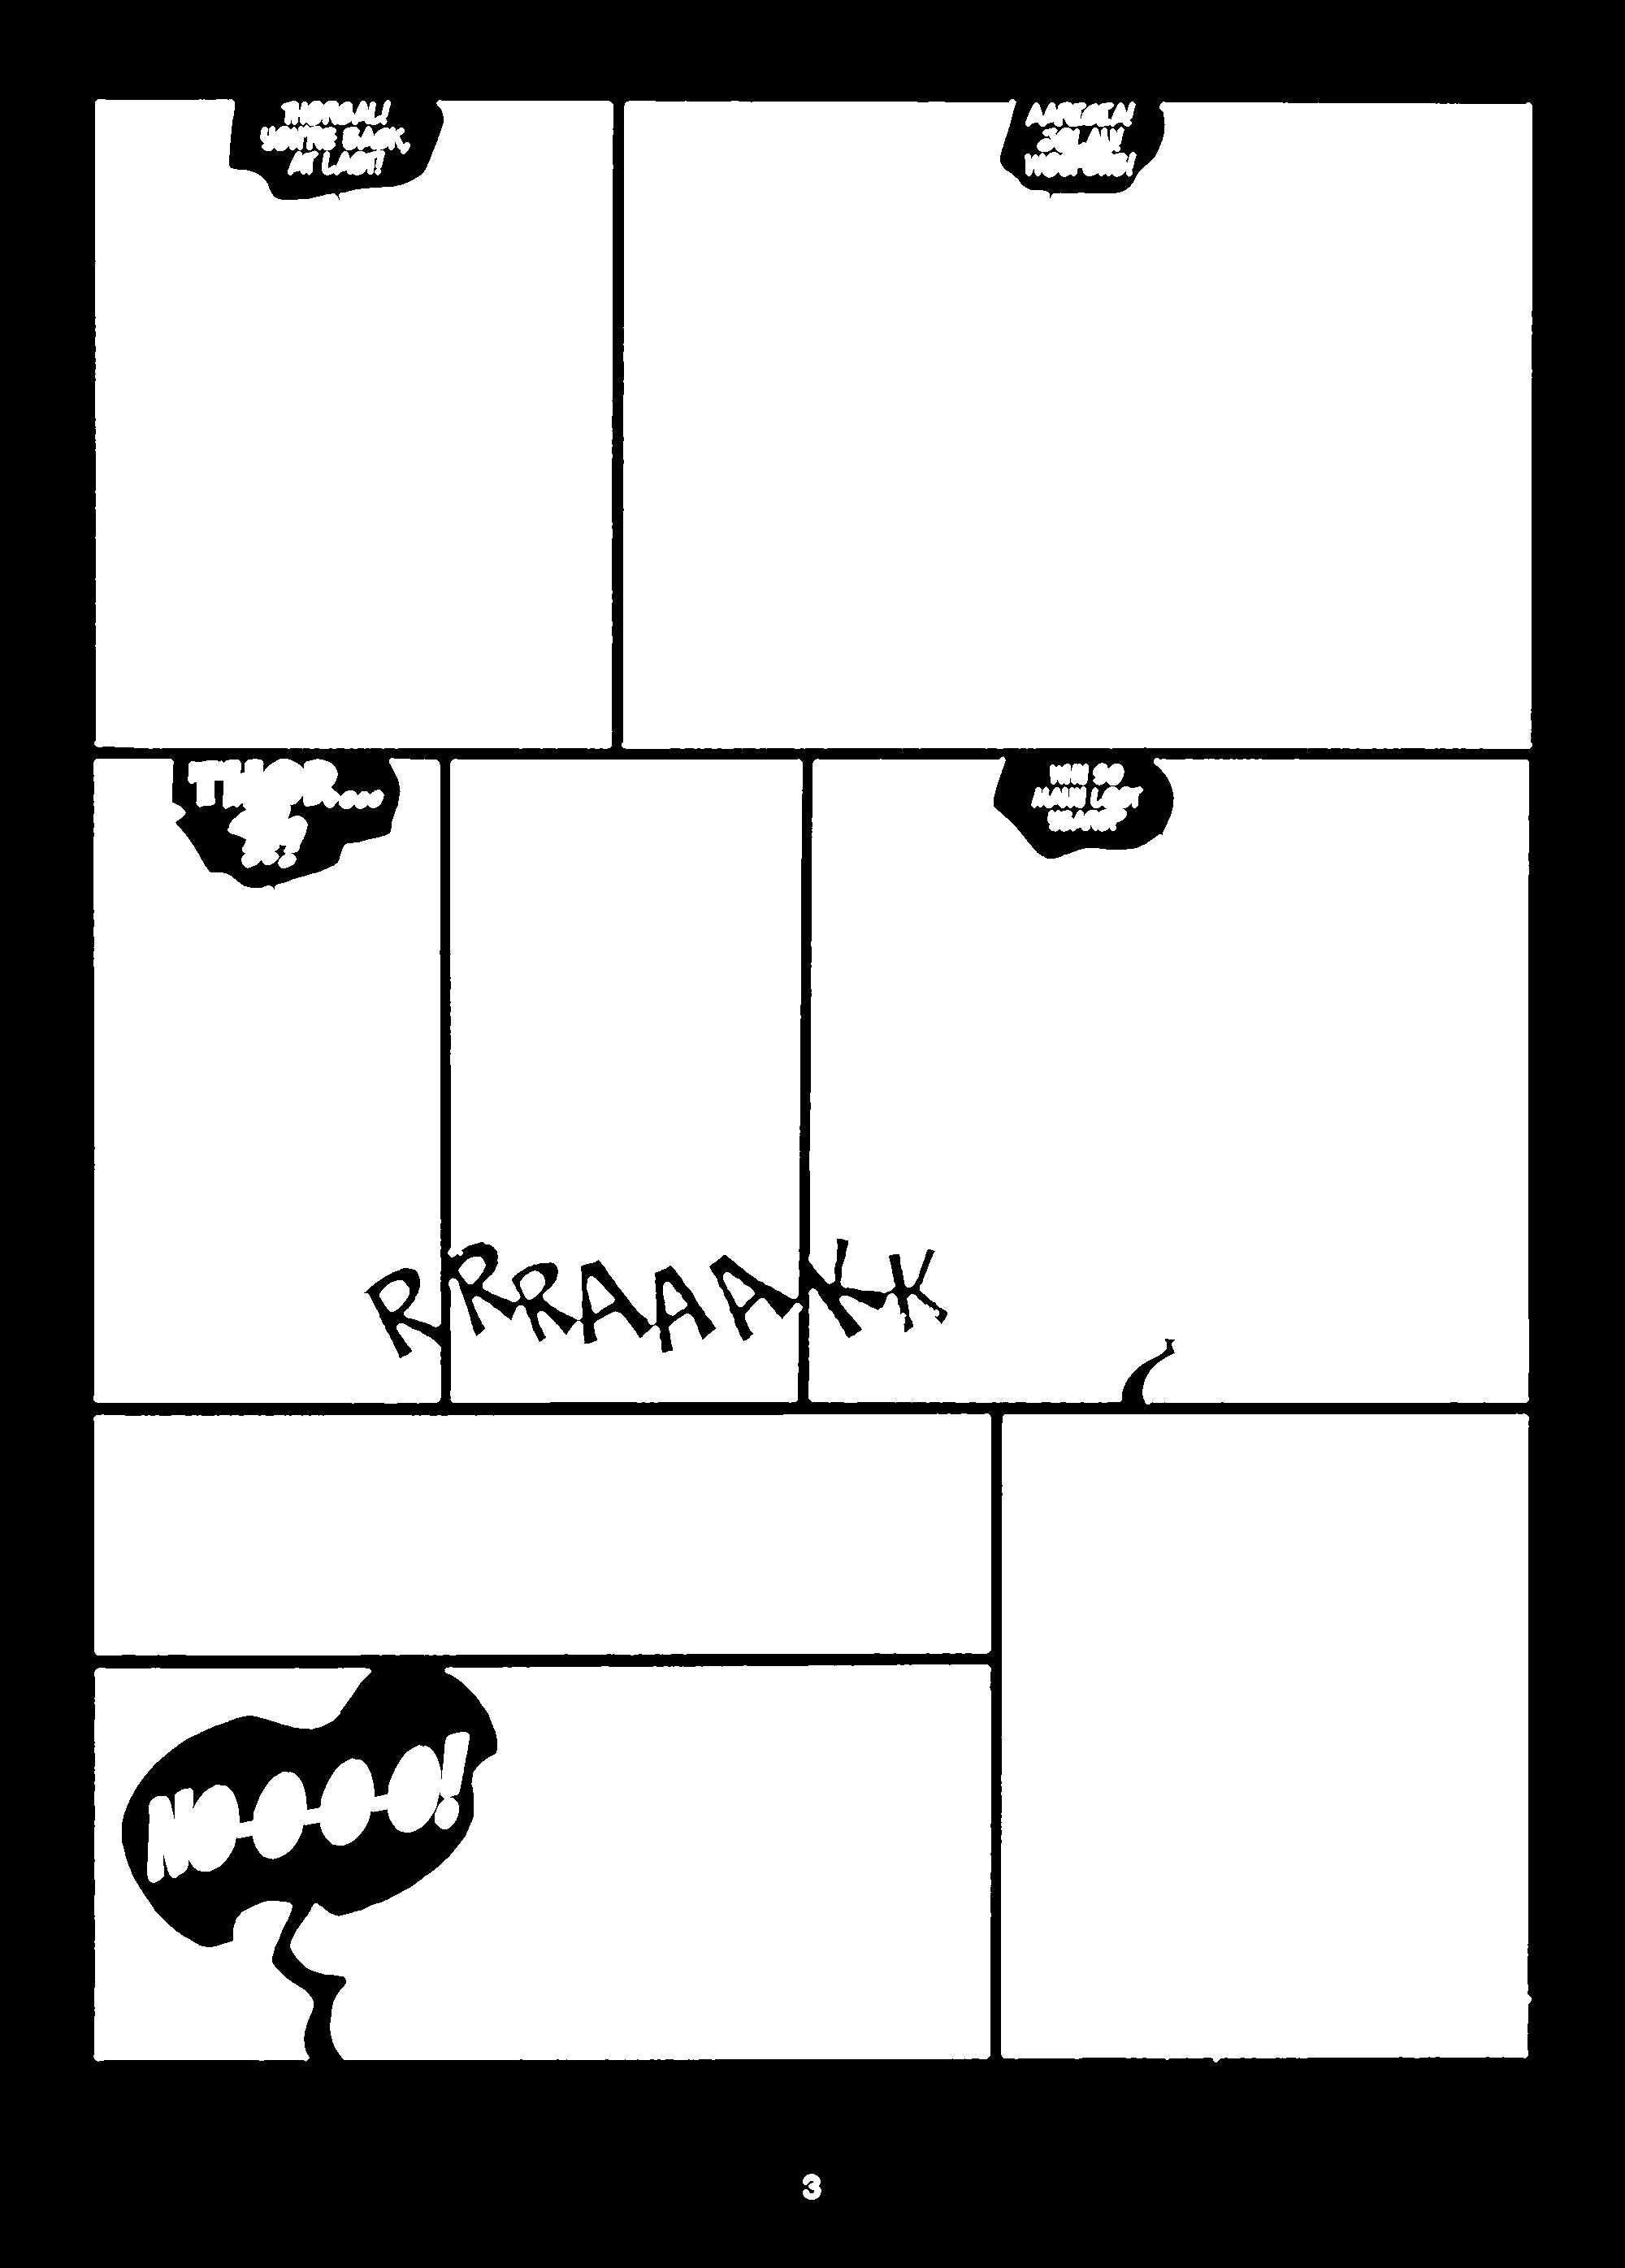
One case I haven’t handled is when speech bubbles are spread across multiple panels. This causes the panel bounding box to overlap, which actually causes an infinite recursion. For instance, see the following image, and the bounding boxes obtained before the clustering step.

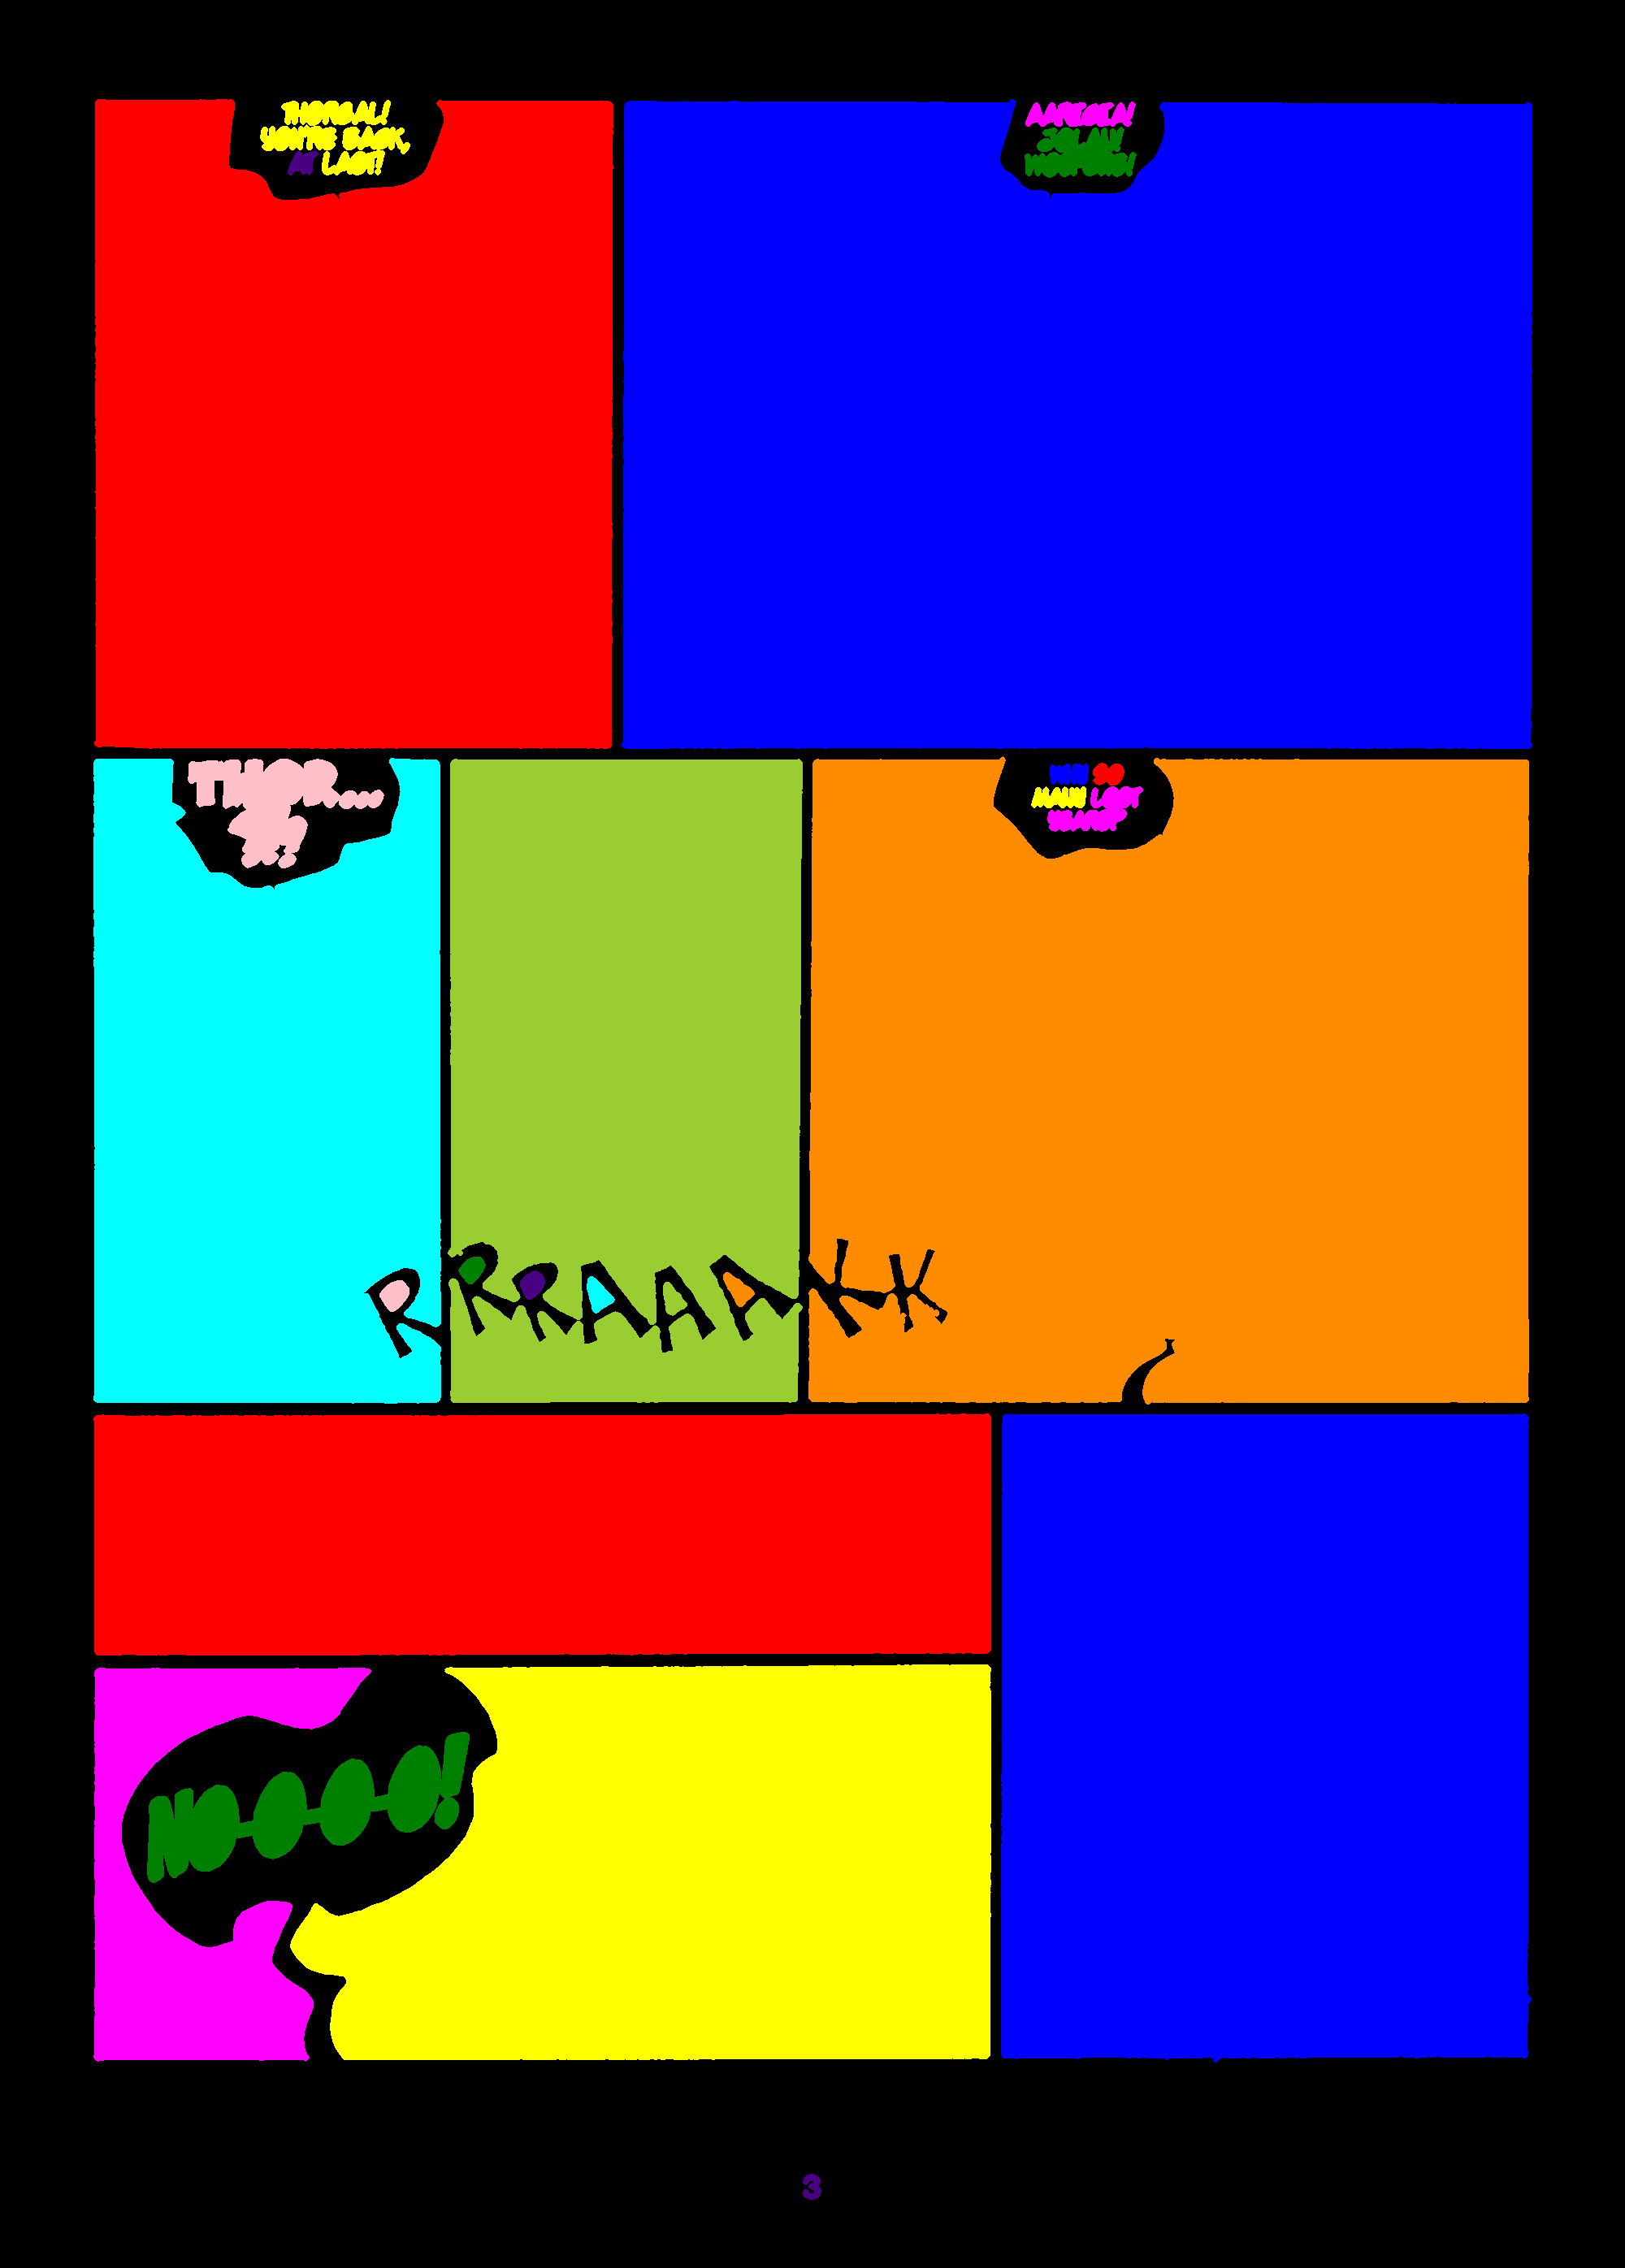
Another thing I didn’t take care of is the handling of non-square panels. For example, in the following image, the clustering process regroups the panels on the fourth row because they are aligned both horizontally and vertically, due to the fact the panels are not rectangular.
I’m sure there are other edge cases out there. However, I’m quite confident it’s possible to build a robust pipeline that handles almost all cases. I’ll leave that as an exercise for the reader ツ
Further reading
I initially set out to work on this without checking what had already been done. But afterwards I found a few related things:
- Digital Comics Image Indexing Based on Deep Learning
- Segmentation and indexation of complex objects in comic book images
- AI extracts speech bubbles from comic strips
- What do We Expect from Comic Panel Extraction?
- A Robust Panel Extraction Method for Manga
- Segmentation-Free Detection of Comic Panels
I’m actually pleasantly impressed by the amount of work that seems to have been poured into such an apparently trivial topic. Humans never cease to be surprising!