Halftoning with Go - Part 1
Recently I stumbled upon this webpage which shows how to use a TSP solver as a halftoning technique. I began to read about related concepts like dithering and stippling. I don’t have any background in photography but I can appreciate the visual appeal of these techniques. As I understand it these techniques were first invented to save ink for printing. However nowadays printing has become cheaper and the modern use of these technique is mostly aesthetic, at least for images.
Before implementing a strong TSP solver to produce similar images than the ones shown in the webpage, I want to implement some simpler halftoning methods to get a feel for the field.
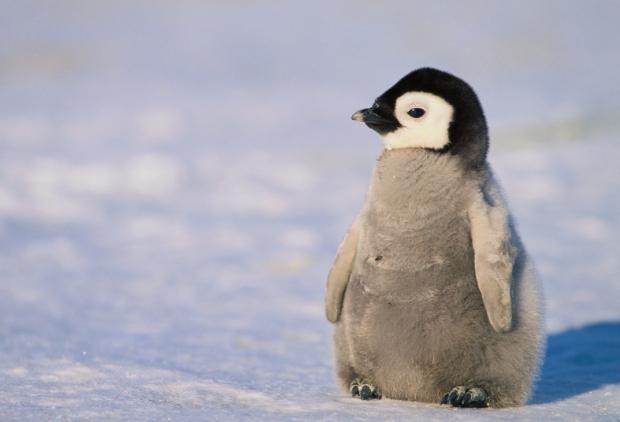
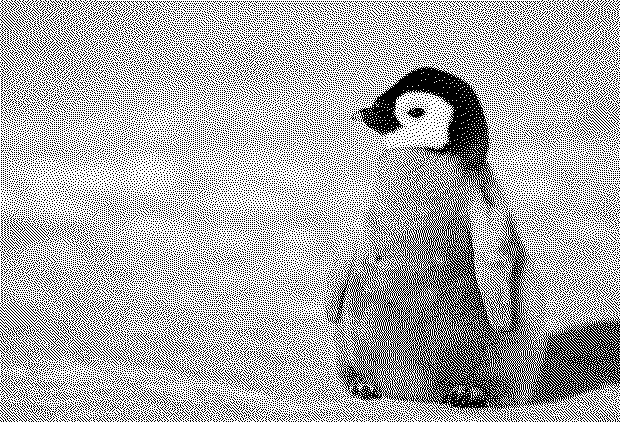
I will be doing this in Go and will be using the following image to compare the output of each method. For the sake of simplicity I will only look into black and white halftoning.
Average dithering
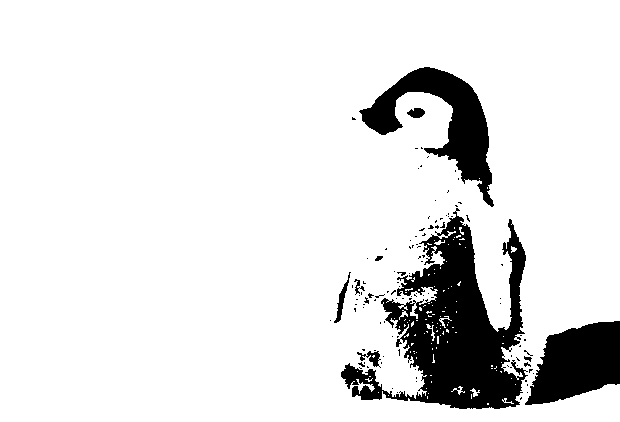
Average dithering - also called thresholding - is the simplest dithering algorithm one may think of. The idea is to compare each pixel in a grayscale image to a threshold and to turn to the pixel to black or white based on its intensity.
First and foremost, let’s write down some code to open an image.
func loadImage(filepath string) (image.Image, error) {
    infile, err := os.Open(filepath)
    if err != nil {
        return nil, err
    }
    defer infile.Close()
    img, _, err := image.Decode(infile)
    if err != nil {
        return nil, err
    }
    return img, nil
}
Go does some magic with image.Decode(infile) to determine if the file is a PNG, a JPEG etc. It works fine as long as you register the format by importing the right package:
import _ "image/png"
This is quite well explained the image package overview.
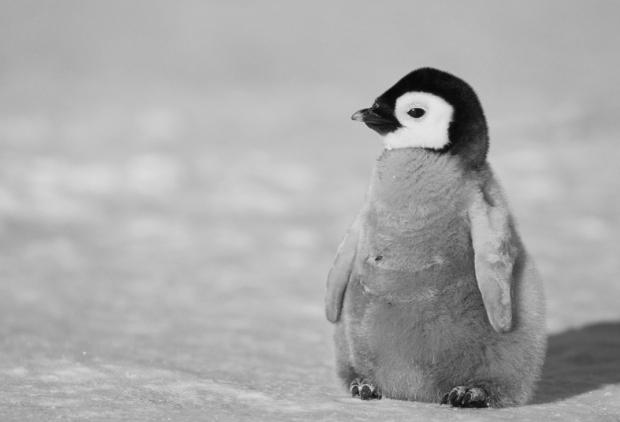
Now let’s write a function to convert a colored image to a grayscale one. The previous function opens a file and interprets it as an image with RGBA values ranging from 0 to 255. The image package provides a struct called image.Gray where each pixel is determined by a single value ranging from 0 to 255 representing how black (0) or white (255) the pixel is. The image.Gray struct provides a handy method called Set(x, y, c) which, well, sets a pixel located at (x, y) to a given RGBA color c. The method will take care of converting the provided RGBA color to an intensity of gray for us.
func rgbaToGray(img image.Image) *image.Gray {
    var (
        bounds = img.Bounds()
        gray   = image.NewGray(bounds)
    )
    for x := 0; x < bounds.Max.X; x++ {
        for y := 0; y < bounds.Max.Y; y++ {
            var rgba = img.At(x, y)
            gray.Set(x, y, rgba)
        }
    }
    return gray
}
Let’s try this out!
func main() {
    var img, _ = loadImage("penguin.jpg")
    var gray = rgbaToGray(img)

    // Save as gray.png
    f, _ := os.Create("gray.png")
    defer f.Close()
    png.Encode(f, gray)
}
We are also going to need to write a function to round a grayscale color to black or white. I’m doing with the benefit of hindsight; it is going to be a common operation and thus creating a separate function will spare us some lines of code.
func blackOrWhite(g color.Gray) color.Gray {
    if g.Y < 127 {
        return color.Gray{0} // Black
    }
    return color.Gray{255} // White
}
Finally we are going to need a method for producing empty white images so that they can be written over.
func newWhite(bounds image.Rectangle) *image.Gray {
    var white = image.NewGray(bounds)
    for i := range white.Pix {
        white.Pix[i] = 255
    }
    return white
}
Now that the basics are out of the way, we can get into the thick of it. Threshold dithering is very simple; indeed we only have to iterate through each pixel and compare its intensity to a threshold between 0 and 255. In Go the grayscale values are the uint8 type, meaning that they are unsigned ints written with 8 bits, thus our threshold value shall also be a uint8.
func ThresholdDither(gray *image.Gray) *image.Gray {
    var (
        bounds   = gray.Bounds()
        dithered = image.NewGray(bounds)
        width    = bounds.Dx()
        height   = bounds.Dy()
    )
    for i := 0; i < width; i++ {
        for j := 0; j < height; j++ {
            var c = blackOrWhite(gray.GrayAt(i, j))
            dithered.SetGray(i, j, c)
        }
    }
    return dithered
}
Let’s see what we obtain.
func main() {
    var img, _ = loadImage("penguin.jpg")
    var gray = rgbaToGray(img)
    var dithered = ThresholdDither(gray, 122)

    f, _ := os.Create("dithered.png")
    defer f.Close()
    png.Encode(f, dithered)
}
Grid distribution
Overview
The resulting image from threshold dithering puts big patches of black when a lot of close pixels are dark. The dithering process doesn’t take into account the neighborhood of each pixel. For example turning a few pixels in a black patch to white would convey the same information whilst requiring less ink. This intuition is the basis of most halftoning techniques.
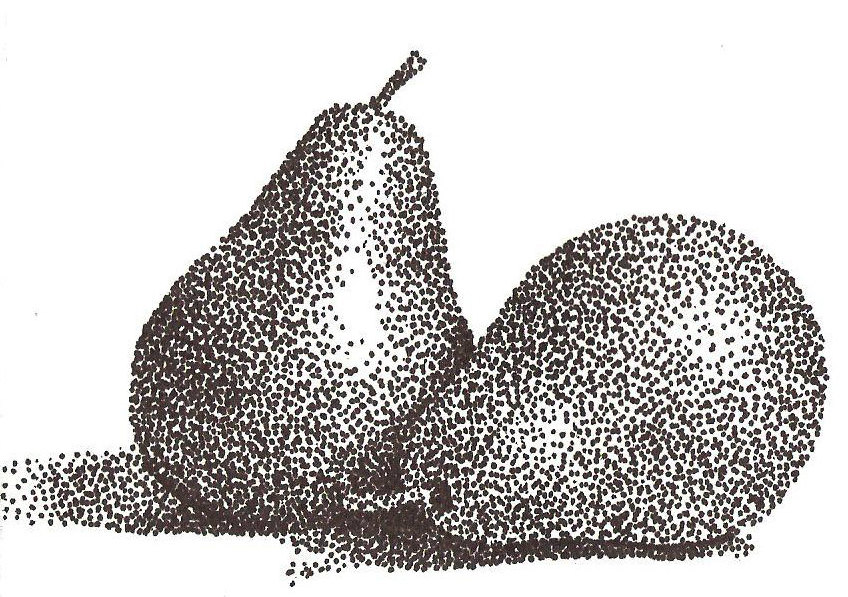
When Bosch and Herman published their “TSP art” paper in 2005, they proposed an algorithm for generating points that ressembles the original grayscale image. The points are produced based on the density of image - more black dots are generated in darker regions of the image - however not too many dots are produced. As we will see this method doesn’t produce great images and thus it doesn’t have any proper name in the literature, it’s simply called “Bosch and Herman’s grid-based method”. The method requires performing the following steps:
1. Split the image in a grid of cells of size $$k$$
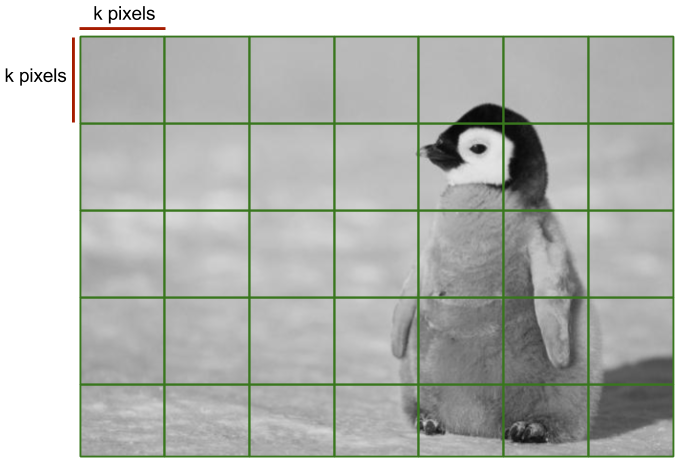
It is easy to see that the number of cells $C$ in the grid is
$$C = \frac{height}{k} \times \frac{width}{k}$$
If the width and the height of the image is not a multiple of $k$, then the cells at the bottom and the right will be cutoff. In this case cells on the right side be will be of width $width \bmod k$; similarly the height of the cells on the bottom side will be $height \bmod k$.
2. Calculate the average darkness in each cell
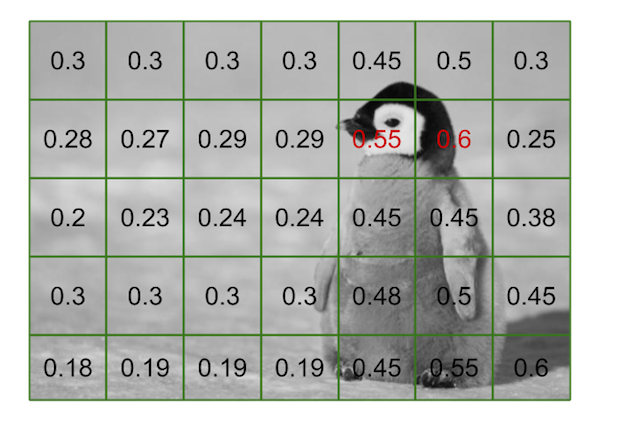
We want to know how dark is a cell. The reason why will be clear in step 3. To do so we can simply calculate the average gray intensity and divide it by 256. This way we obtain a ratio $\mu$ – this is how it is denoted in the paper – with $\mu \in [0, 1]$. Mathematically, for each cell $c_{i,j}$ we will create an associated $\mu_{i,j}$ which is
$$\mu_{i,j} = \frac{1}{256k^2} \times \sum_{m=ik}^{ik+k} \sum_{n=jk}^{jk+k} I_{m,n}$$
where $I$ is the matrix containing the pixel intensities of the grayscale image. Of course the formula would be slightly less elegant if we were to take into account the squares on the right and on the bottom that are cut off. Regardless, the previous equation is just a fancy way of representing two simple for loops; as can be seen in the following snippet. The only thing to remember is that the closer each $\mu_{i,j}$ is to 0, the darker the matching cell is.
func avgIntensity(gray *image.Gray) float64 {
    var sum float64
    for _, pix := range gray.Pix {
        sum += float64(pix)
    }
    return sum / float64(len(gray.Pix)*256)
}
3. Sample points in each cell based on the cell’s density
Based on each cell’s density, we want to place a number $n$ of black pixels into a new cell. Denser cells will produce more points whereas empty will produce less. Bosch and Herman proposed the following formula for determining $n$:
$$n = (1-\mu) \times \gamma$$
where $\gamma$ is the maximum of number of black points to sample.
Implementation
func GridDither(gray *image.Gray, k int, gamma float64) *image.Gray {
    var (
        bounds   = gray.Bounds()
        dithered = newWhite(bounds)
        width    = bounds.Dx()
        height   = bounds.Dy()
        rng      = rand.New(rand.NewSource(time.Now().UnixNano()))
    )
    for i := 0; i < width; i += k {
        for j := 0; j < height; j += k {
            var (
                cell = rgbaToGray(gray.SubImage(image.Rect(i, j, i+k, j+k)))
                mu   = avgIntensity(cell)
                n    = (1-mu)*gamma
            )
            for k := 0; k < int(n); k++ {
                var (
                    x = randInt(i, min(i+k, width), rng)
                    y = randInt(j, min(j+k, height), rng)
                )
                dithered.SetGray(x, y, color.Gray{0})
            }
        }
    }
    return dithered
}
randInt(min, max) is a custom method for generating a random number in range $[min, max)$.
func randInt(min, max int, rng *rand.Rand) int {
    return rng.Intn(max-min) + min
}
Let’s look at the output of the grid-based method for $k=5$ and $\gamma=8$ - usually picking a small $k$ works best.
func main() {
    var img, _ = loadImage("penguin.jpg")
    var gray = rgbaToGray(img)
    var dithered = GridDither(gray, 10, 8)

    f, _ := os.Create("dithered.png")
    defer f.Close()
    png.Encode(f, dithered)
}
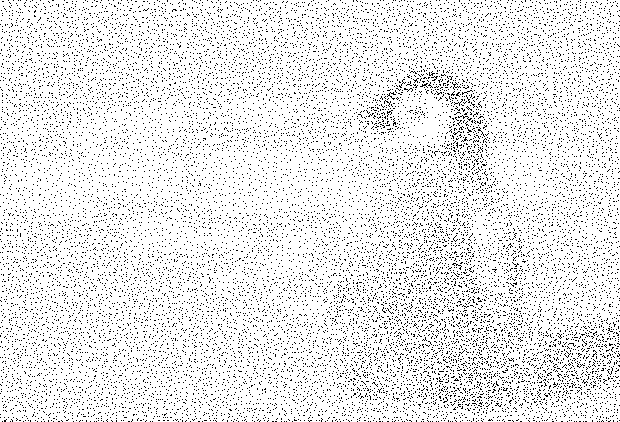
The penguin is recognizable, however there is a lot of “noise” on the left part of image. This is because although the cells are not very dark, there can still be a few blacks points that are sampled because there isn’t any minimum bounds on $n$. What’s more, it would be nice to add some contrast to the image to render more points in darker cells. Bosch and Herman proposed to amplify $n$ in the following way:
$$n = \frac{((1-\mu) \times \gamma)^2}{3}$$
The formula isn’t magic, it just takes some tinkering to get right. Because we are working on results with visual appeal, there isn’t really any theoretical background to justify these formulas. Practice makes perfect!
As for the minimum number of points, we can simply include an if condition and set $n$ to 0 if $n$ is lower than a threshold $\alpha$. The modified code is the following:
func GridDither(gray *image.Gray, k int, alpha, gamma float64) *image.Gray {
    var (
        bounds   = gray.Bounds()
        dithered = newWhite(bounds)
        width    = bounds.Dx()
        height   = bounds.Dy()
        rng      = rand.New(rand.NewSource(time.Now().UnixNano()))
    )
    for i := 0; i < width; i += k {
        for j := 0; j < height; j += k {
            var (
                cell = rgbaToGray(gray.SubImage(image.Rect(i, j, i+k, j+k)))
                mu   = avgIntensity(cell)
                n    = math.Pow((1-mu)*gamma, 2) / 3
            )
            if n < alpha {
                n = 0
            }
            for k := 0; k < int(n); k++ {
                var (
                    x = randInt(i, min(i+k, width), rng)
                    y = randInt(j, min(j+k, height), rng)
                )
                dithered.SetGray(x, y, color.Gray{0})
            }
        }
    }
    return dithered
}
With the same parameters ($k=5$ and $\gamma=8$) and $\alpha=3$ the following image is obtained.
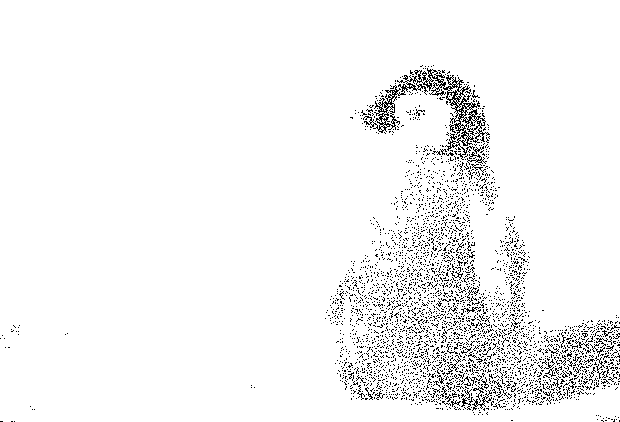
The result is a huge step forward. The same patches from threshold dithering are preserved, but they contain way less pixels. However we can’t say that the image is very appealing in an artistic sense. For example there are not no continuous curves that seem to appear, nor are the black points evenly spaced. What’s more, there are quite a few parameters to tweak, which isn’t very practical if one wishes to build a generic halftoning method. Luckily there exist many more smarter algorithms for producing “better” halftoned images.
Floyd-Steinberg dithering
Before talking about Floyd-Steinberg dithering, let’s briefly delve into the concept of error diffusion. The issue with the previous methods is that when a pixel was set to black, this information was not taken into account when considering turning to black a neighboring pixel. With error diffusion, the idea is to “carry” the difference between a pixel’s intensity and a threshold - this is called the quantization error - to the neighboring cells so as to reverse the turning into black or white decision. Admitedly this is still a vague concept, but it’s worth understanding!
The easiest error diffusion method is simply to add the quantization error of a pixel to the next one when looping through the image. For example, say a pixel’s intensity is 90 and the threshold is 120, then the pixel is turned to black because 90 is lower than 120; the quantization error is $90-0=90$. Then say that the next pixel has an intensity of 80. Instead of setting it to 0 because it is lower than 120, add the quantization error of the previous pixel and turn it to white because $80+90=170$ which is higher than 120. The quantization error of that pixel is then $170-255=-85$. This way turning a pixel to black will “discourage” the next pixel to be turned to black.
Algorithms such Floyd-Steinberg dithering use this principle and “spread” each pixel’s quantization error following a certain pattern. This is quite well explained on the error diffusion Wikipedia article so I’m not going to explain it in detail. With the Floyd-Steinberg variant, the idea is to spread the quantization error in the following way:
      X      7/16
3/16  5/16   1/16
At each pixel X the quantization error is split between the indicated neighbors for the indicated fraction. For example the pixel to the left of X will receive 7/16th of the quantization error. The fractions may seem arbitrary, but I can assure you that Floyd and Steinberg had their reasons for choosing. Regardless, let’s implement this procedure.
func FloydSteinbergDither(gray *image.Gray) *image.Gray {
    var (
        bounds   = gray.Bounds()
        width    = bounds.Dx()
        height   = bounds.Dy()
        dithered = copyGray(gray)
    )
    for j := 0; j < height; j++ { // Top to bottom
        for i := 0; i < width; i++ { // Left to right
            var oldPixel = dithered.GrayAt(i, j)
            // Set the pixel to black or white
            var newPixel = blackOrWhite(oldPixel)
            dithered.SetGray(i, j, newPixel)
            // Determine the quantization error
            var quant = (int16(oldPixel.Y) - int16(newPixel.Y)) / 16
            // Right pixel
            dithered.SetGray(
                i+1,
                j,
                color.Gray{i16ToUI8(int16(dithered.GrayAt(i+1, j).Y) + 7*quant)}
            )
            // Bottom left pixel
            dithered.SetGray(
                i-1,
                j+1,
                color.Gray{i16ToUI8(int16(dithered.GrayAt(i-1, j+1).Y) + 3*quant)}
            )
            // Bottom pixel
            dithered.SetGray(
                i,
                j+1,
                color.Gray{i16ToUI8(int16(dithered.GrayAt(i, j+1).Y) + 5*quant)}
            )
            // Bottom right pixel
            dithered.SetGray(
                i+1,
                j+1,
                color.Gray{i16ToUI8(int16(dithered.GrayAt(i+1, j+1).Y) + quant)}
            )
        }
    }
    return dithered
}
The image and the color packages are not magic: types have to be modified explicitly in order to perform certain operations. Each pixel in a grayscale image is basically a uint8, which is an unsigned integer which can take values in $[0, 255]$. When the error is spread to the neigboring pixels, it’s possible that the intensity of the pixel added to the error will overflow the receiving uint8 variable. Thus I temporarily convert the intensity to uint16 which won’t overflow. Then I convert it back to a uint8 but I take into account if the uint16 is beyond the capacity of the uint8. For example in Go uint8(-42) returns $255 + (-42) = 214$. The function I use to overcome this little issue is quite simple:
func i16ToUI8(x int16) uint8 {
    switch {
    case x < 1:
        return uint8(0)
    case x > 254:
        return uint8(255)
    }
    return uint8(x)
}
I also used a function to clone a grayscale image.
func copyGray(gray *image.Gray) *image.Gray {
    var clone = image.NewGray(gray.Bounds())
    copy(clone.Pix, gray.Pix)
    return clone
}
Let’s have a look at the result. I’m not going to write the main function, it’s getting a bit redundant.
The result from the Floyd-Steinberg seems more “appealing”. The penguin has sharper features and his fur is more distinguishable. Also if you look at the penguin’s face you might notice how evenly spread the dots are. I find it oddly satisfying. There exist many more error diffusion algorithms that produce more or less similar images. For example some spread the quantization error to further pixels instead of just the adjacent ones.
Conclusion
That wraps it up for this post! I hope you had a nice read. In the next blog post I’ll be looking at a more advanced algorithm called weighted centroidal Voronoï diagrams, which is a stippling technique.
If this post peaked your interest, have a look at this, I thought it was quite an interesting read.
The code in this blog post is available on GitHub. It’s not exactly the same; for example I’ve used an interface, but it’s nothing complicated. Basically I’m thinking of making a little package for halftoning in Go, I’ll see how it goes.