Morellet crosses with JavaScript
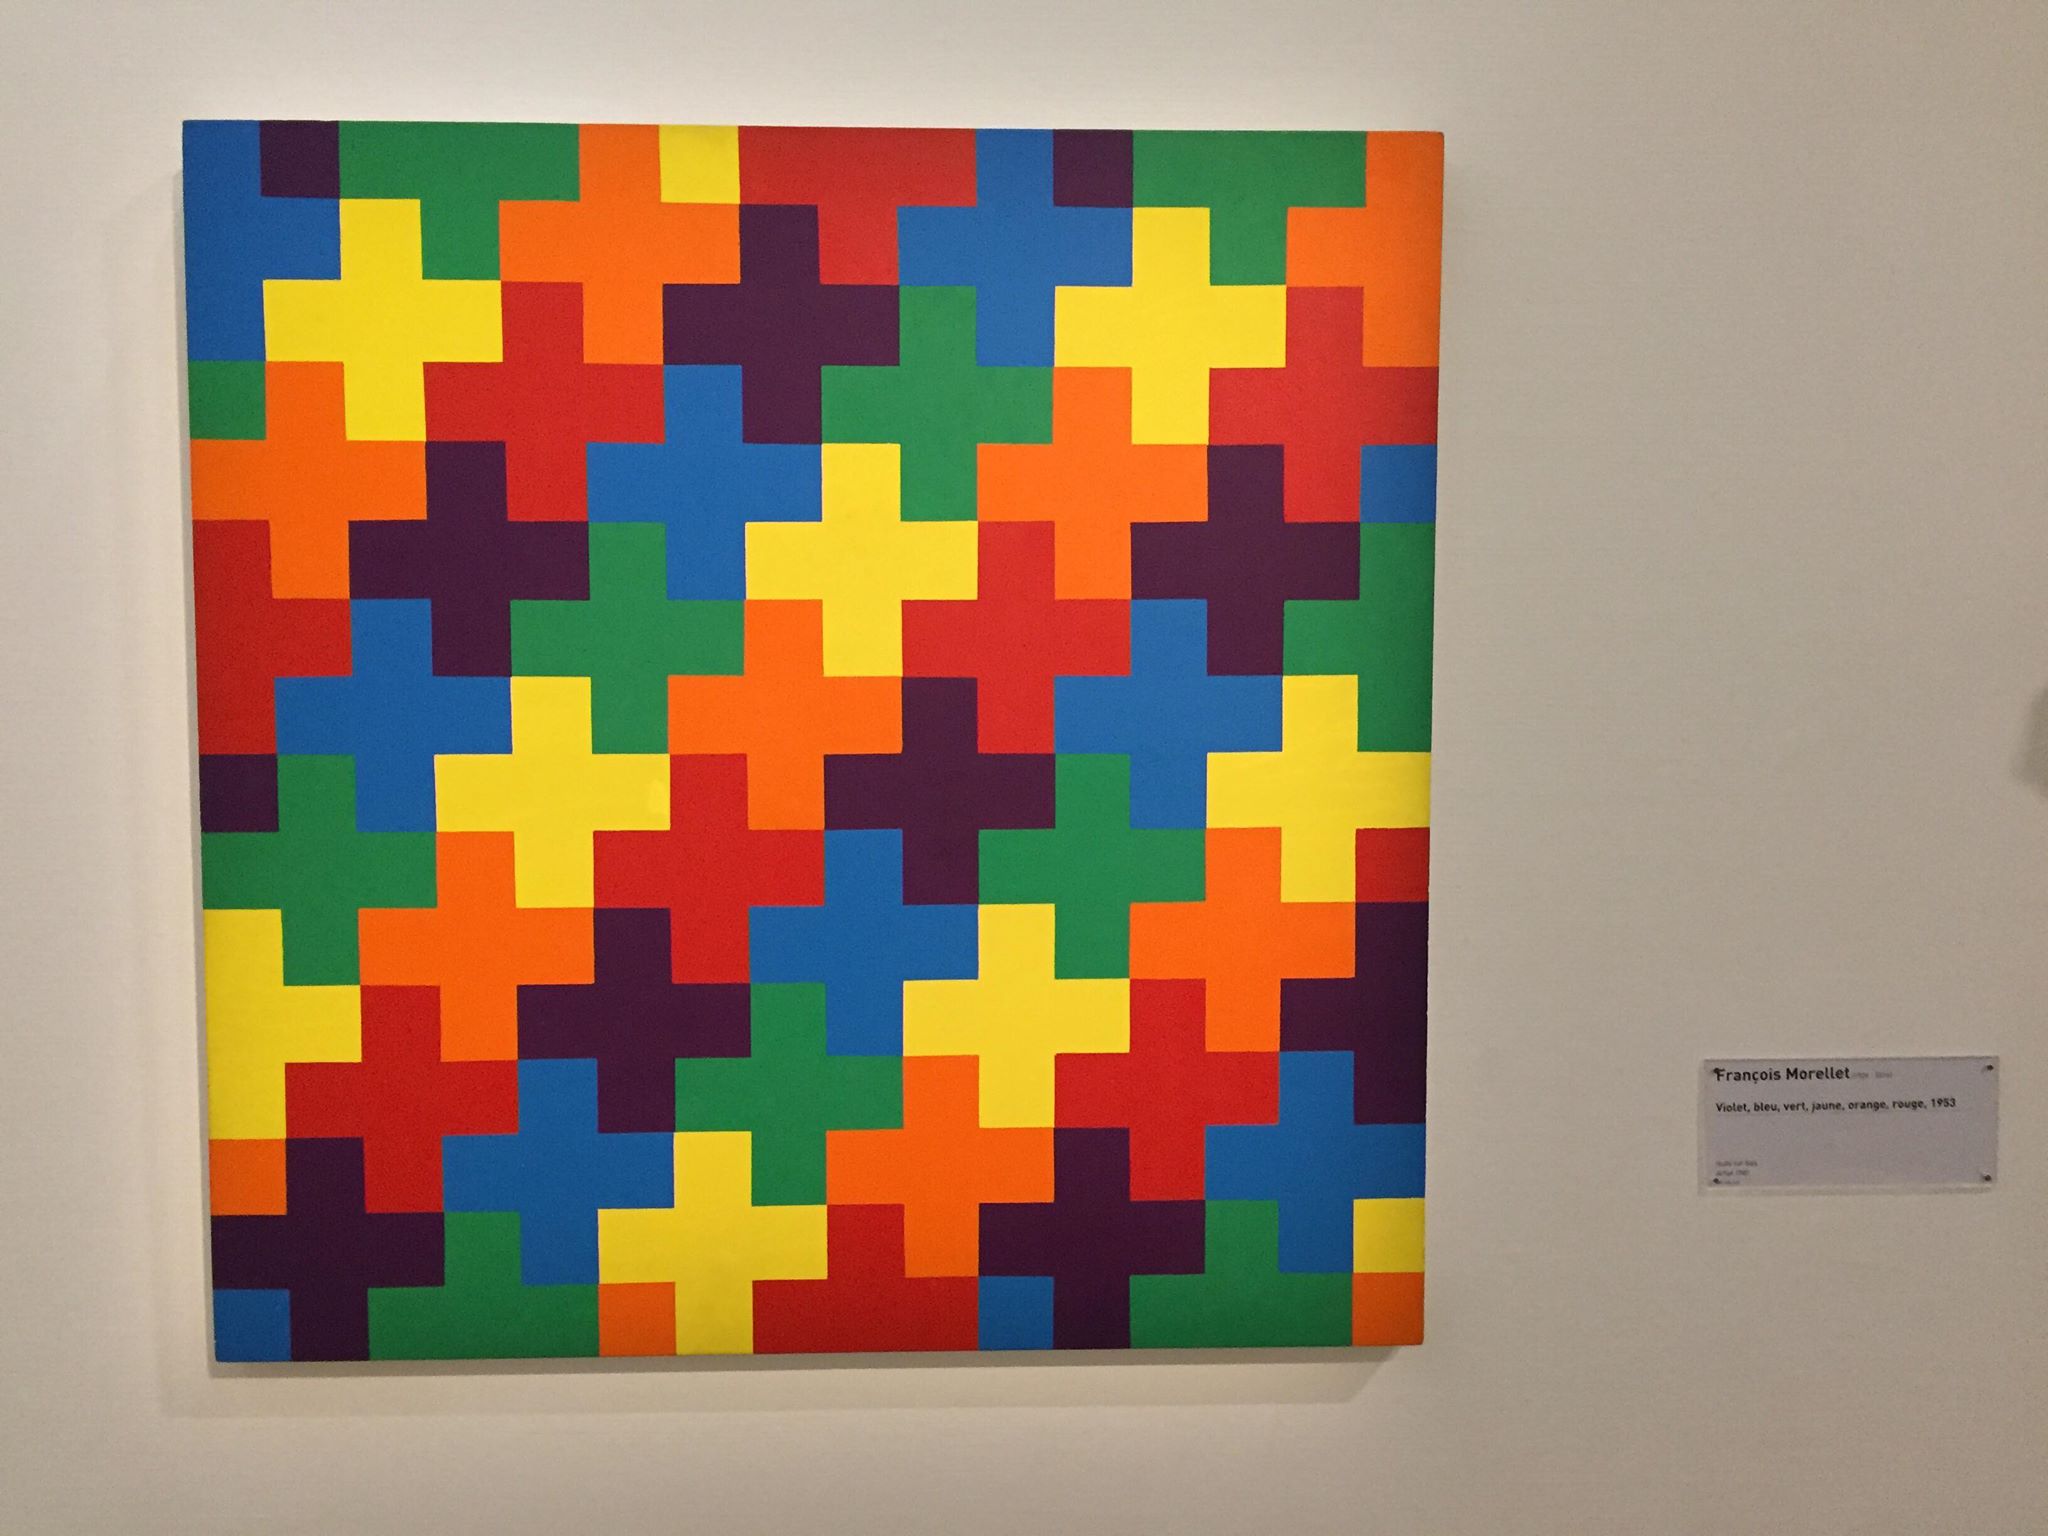
The days I’m working on a deep learning project. I hate it but I promised myself to give it a real try. My scripts are taking a long time so I decided to do some procedural art while I waited. This time I’m going to reproduce the following crosses made by François Morellet. I saw them the last I went to the Musée Pompidou with some friends from university. I don’t have any smartphone anymore so one my friends was kind enough to take a few pictures for me, including this one. The painting is called Violet, bleu, vert, jaune, orange, rouge.
This isn’t particularly difficult to reproduce but it is satisfying nonetheless. As per usual I’m going to start by defining a Point class.
class Point {
    constructor(x, y) {
        this.x = x;
        this.y = y;
    }
}
My intention is to have some kind of Cross class and then do some sort of for loop. The details of the for loop are the most tricky part, we’ll come back to them further on. Let’s first implement the Cross class. I simply represented a cross as a stitch of 5 squares. My idea is that if I’m given the center of the cross then I guess the coordinates of the squares that it is composed of. The first thing to do is thus to define a Square class. We’ll give it a draw method to display it on a canvas. The drawing procedure starts at the top-left of the square and makes it way around each corner in a clockwise manner.
class Square {
  constructor (origin, length, colour) {
    this.origin = origin
    this.length = length
    this.colour = colour
  }

  draw (ctx) {
    // Draw clockwise
    ctx.beginPath()
    ctx.moveTo(this.origin.x, this.origin.y)
    ctx.lineTo(this.origin.x + this.length, this.origin.y)
    ctx.lineTo(this.origin.x + this.length, this.origin.y + this.length)
    ctx.lineTo(this.origin.x, this.origin.y + this.length)
    ctx.lineTo(this.origin.x, this.origin.y)
    // We want the border color and the fill color to match
    ctx.strokeStyle = this.colour;
    ctx.fillStyle = this.colour;
    // Color the border and the body
    ctx.stroke();
    ctx.fill();
    ctx.closePath();
  }
}
As an example let’s draw such a square. We haven’t initialized a canvas context yet so let’s do just that.
var canvas = document.getElementById('doodle')
var ctx = canvas.getContext('2d')

var square = new Square(new Point(300, 200), 140, '#177b4b')
square.draw(ctx)

We can now define a Cross class in a rather short amount of lines.
class Cross {
  constructor (left, top, right, bottom, center) {
    this.left = left
    this.top = top
    this.right = right
    this.bottom = bottom
    this.center = center
  }

  draw (ctx) {
    this.left.draw(ctx);
    this.top.draw(ctx);
    this.right.draw(ctx);
    this.bottom.draw(ctx);
    this.center.draw(ctx);
  }
}
The next step is to be able to create a cross given it’s center and the side length of each square it is made of. With these two pieces of information we can guess the positions of the squares. This isn’t too difficult to work out yourself but a diagram can’t hurt.
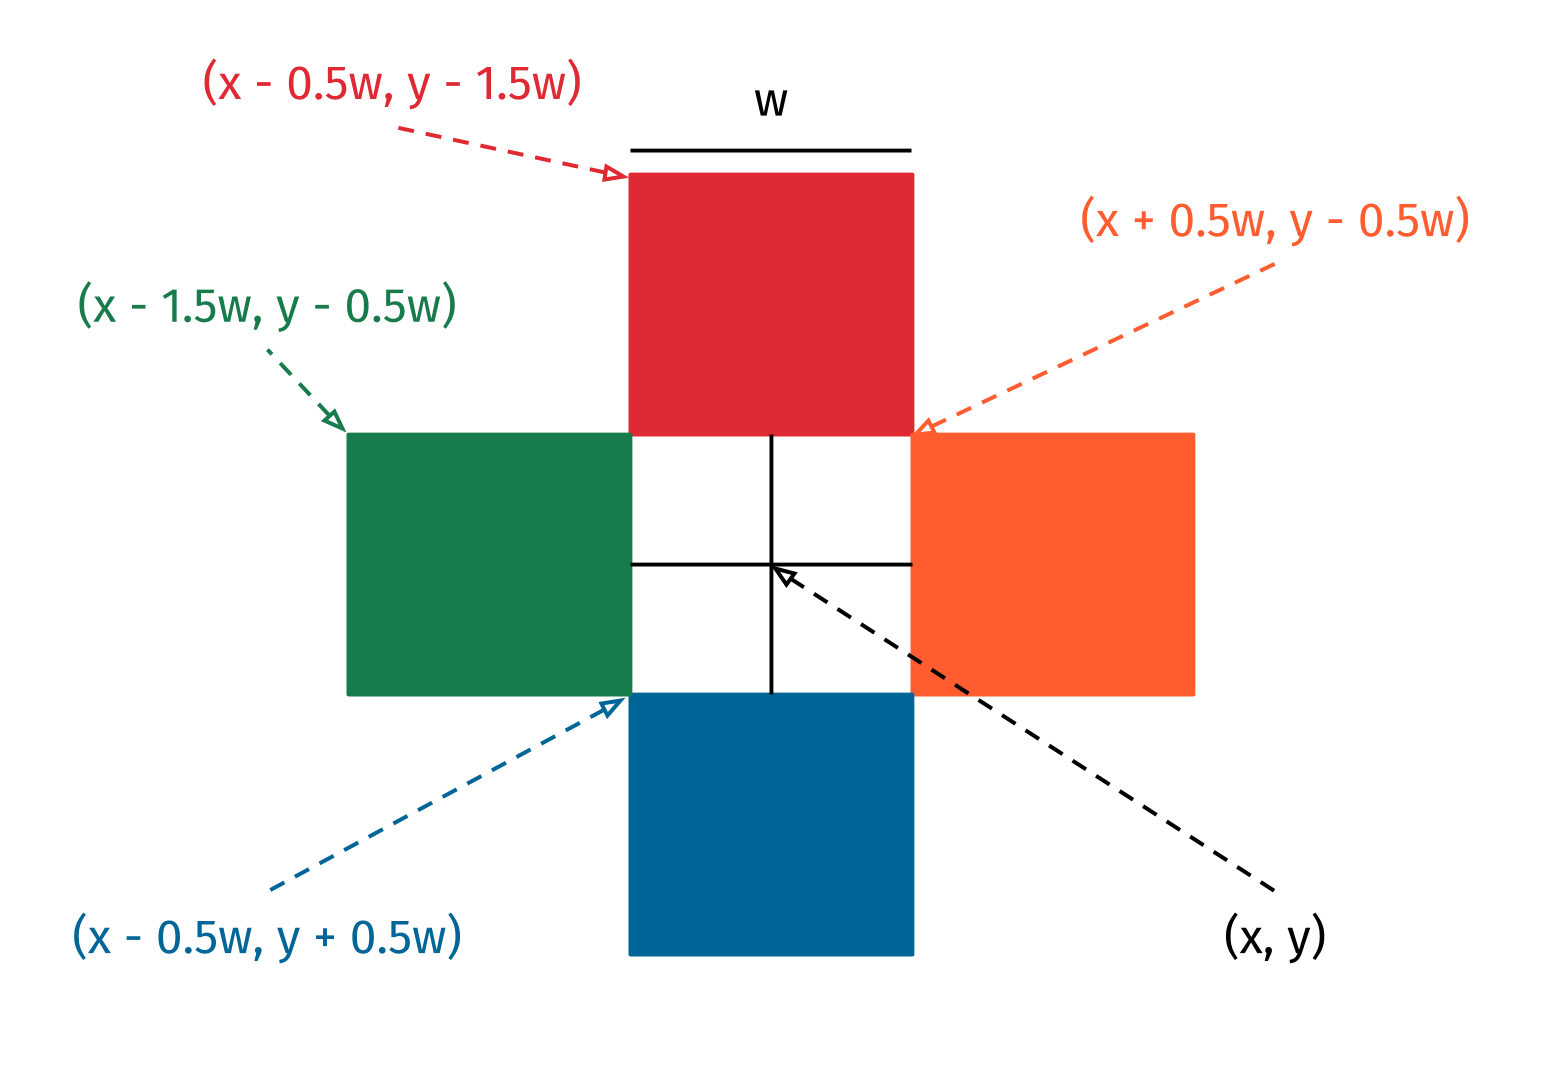
We can write down the logic inside a makeCross function.
function makeCross(center, squareLength, color) {
  // For convenience
  var l = squareLength
  var x = center.x
  var y = center.y
  // Create the 5 squares
  var left   = new Square(new Point(x - 1.5 * l, y - 0.5 * l), l, color)
  var top    = new Square(new Point(x - 0.5 * l, y - 1.5 * l), l, color)
  var right  = new Square(new Point(x + 0.5 * l, y - 0.5 * l), l, color)
  var bottom = new Square(new Point(x - 0.5 * l, y + 0.5 * l), l, color)
  var center = new Square(new Point(x - 0.5 * l, y - 0.5 * l), l, color)
  // Assemble the squares and return the resulting cross
  return new Cross(left, top, right, bottom, center)
}
Let’s create a cross as an example.
var cross = makeCross(new Point(300, 200), 140, '#177b4b')
cross.draw(ctx)

I didn’t do it on purpose but the cross looks very much like the signs used by French pharmacies… Now that we can make and draw crosses we should be able to reproduce Morellet’s painting. The painting looks very repetitive so there must some patterns we can exploit. If you look at the top left of the original painting you’ll see a blue cross. The cross that is to it’s direct right is orange. Then the next is blue. And the final one on that “row” is orange. You can basically look at the painting as a stack of three rows where each row has crosses of different colors separated by two squares. The first row is composed of blue and orange crosses, the second row has yellow and purple crosses, whereas the crosses of the third row are red and green.
function drawRow(start, squareLength, color1, color2, ctx) {
  var x = start.x
  var y = start.y
  var i = 0
  while (true) {
    var color = [color1, color2][i % 2]
    makeCross(new Point(x, y), squareLength, color).draw(ctx)
    if (x > 800) { break }
    x = x + 5 * squareLength
    i = i + 1
  }
}
Of course we could have checked that the current x isn’t beyond the canvas inside the while condition, but this would have omitted the left squares of the crosses that are partially on the image. Let’s try this out by drawing the first three rows.
var canvasWidth = 800
var nSquares = 16
var length = canvasWidth / nSquares

var blue = '#006597'
var orange = '#ff5c30'

var yellow = '#ffd652'
var purple =  '#562b42'

var red = '#df2933'
var green = '#177b4b'

drawRow(new Point(length * 0.5, length * 1.5), length, blue, orange, ctx)
drawRow(new Point(length * 2.5, length * 2.5), length, yellow, purple, ctx)
drawRow(new Point(length * 4.5, length * 3.5), length, red, green, ctx)

If we adjust the size of the squares then the image should change accordingly.
var length = canvasWidth / nSquares / 2

drawRow(new Point(length * 0.5, length * 1.5), length, blue, orange, ctx)
drawRow(new Point(length * 2.5, length * 2.5), length, yellow, purple, ctx)
drawRow(new Point(length * 4.5, length * 3.5), length, red, green, ctx)

Looking good! All we have to do now is implement a smart for loop and we should be good. I made a diagram to show where each row starts and the first color of that row. Naturally there are some crosses that start outside of the 16 by 16 grid.

At first I couldn’t manage to think of a for loop that would get the job done. I gave up, watched a movie, went to bed, woke up, had breakfast, and a simple idea came to me. The trick is that nothing is stopping from starting the rows outside of the canvas. Indeed if draw something with, say, negative coordinates then it will simply not get drawn. We can thus simply identify a line that grows beyond the left side of the canvas and start the rows from there. The following diagram shows where the rows will the thus start. You could say this is thinking outside the box – pun intended.

Implementing this is a bit trickier than the rest of the code but it’s not too difficult. In the following piece of code there are two counters i and j which represent the color of the there respective “line”. The idea is that there two lines in the previous diagram, the left one starting in red and the right one starting in purple. We can move from the left line to the right one by moving x 2 squares forward. Likewise we can move the right line to the left by moving back by a stretch of 3 squares. At every step the y moves down by one square – that is, we have to add squareLength to it because the origin is at the top-left of the canvas.
var x = 1.5 * squareLength
var y = -0.5 * squareLength
var i = 0
var j = 5
var rc = 0
var colors = [purple, blue, green, yellow, orange, red]
var mirror = [yellow, orange, red, purple, blue, green]

while (true) {
  // rc % 2 tells use which line we're on
  if (rc % 2 == 0) {
    var idx = i
    i = (i + 1) % 6
  } else {
    var idx = j
    j = (j + 1) % 6
  }
  var color1 = colors[idx]
  var color2 = mirror[idx]
  drawRow(new Point(x, y), squareLength, color1, color2, ctx)
  // Stop if we've gone past the bottom of the canvas
  if (y > 800) { break }
  // Update the first cross coordinates and the row counter
  if (rc % 2 == 0) {
    x = x - 3 * squareLength
  } else {
    x = x + 2 * squareLength
  }
  y = y + 1 * squareLength
  rc = rc + 1
}
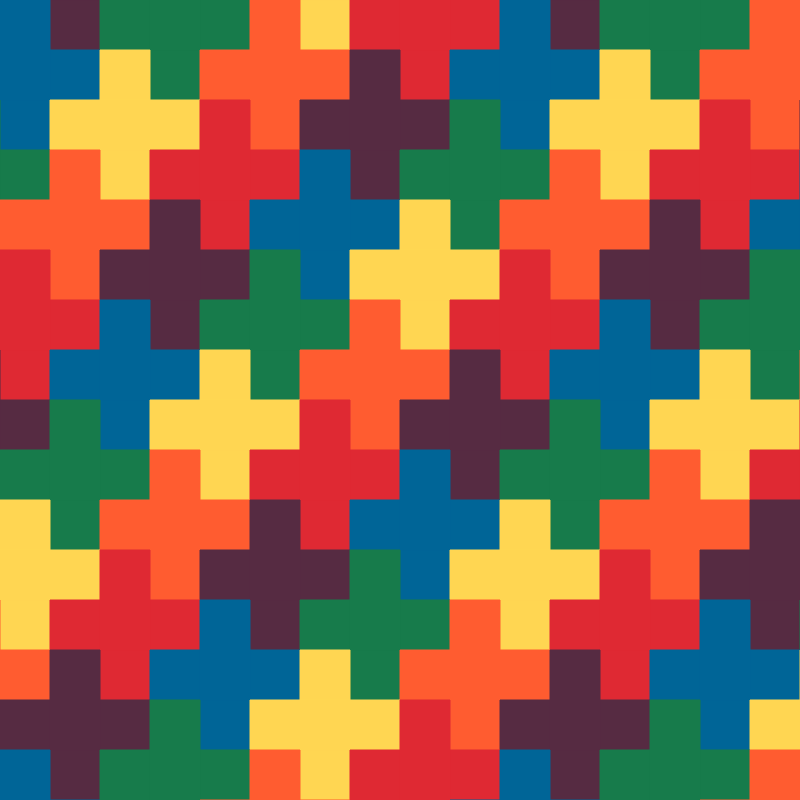
Doing this gives exactly the targeted result.
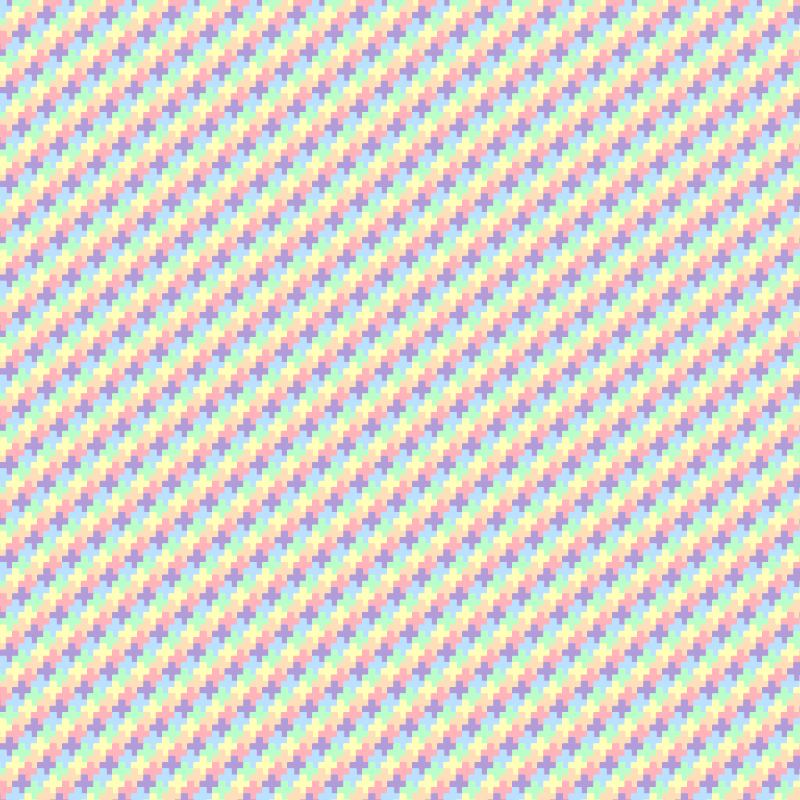
For fun you can change the colors and the size of the squared. In the following image I used a set of 6 pastel colors and set length as canvasWidth / nSquares / 8.
Finally the following images uses the original colors but with a length set to canvasWidth / nSquares / 16.
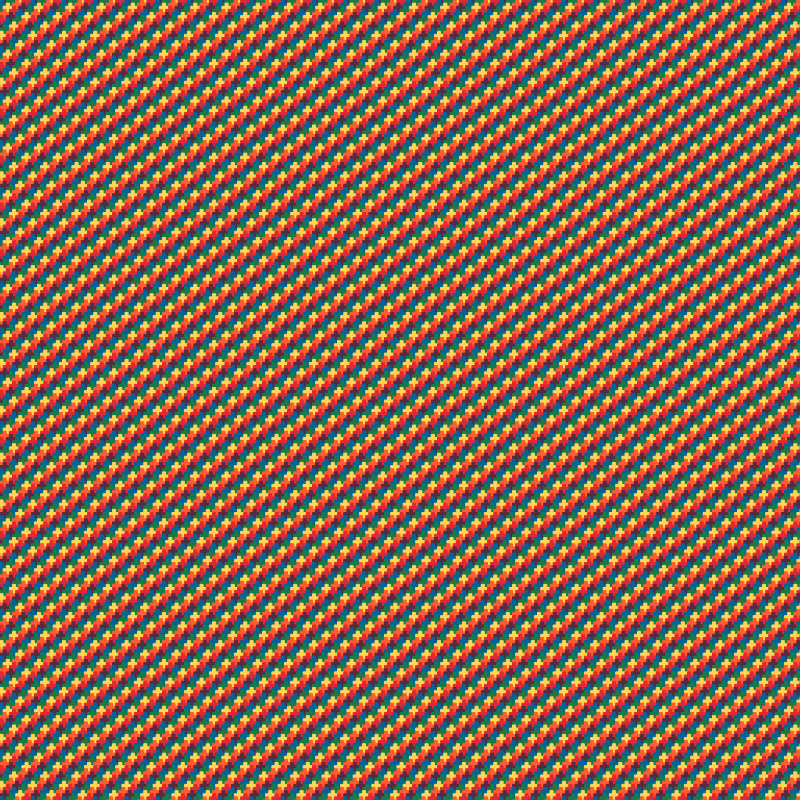
That’s all for now! I hope you enjoyed it. I think it turned to be a tad more complex that I thought it would be, but it’s still nothing really difficult. As per usual the hardest part is translating a thought process to code in a manner that is as terse and as elegant as possible. You can the full code along with the rest of my works on GitHub.