A short introduction and conclusion to the OpenBikes 2016 Challenge
During my undergraduate internship in 2015 I started a side project called OpenBikes. The idea was to visualize and analyze bike sharing over multiple cities. Axel Bellec joined me and in 2016 we won a national open data competition. Since then we haven’t pursued anything major, instead we use OpenBikes to try out technologies and to apply concepts we learn at university and online.
Before the 2016 summer holidays one of my professors, Aurélien Garivier mentioned that he was considering using our data for a Kaggle-like competition between some statistics curriculums in France. Near the end of the summer, I sat down with a group of professors and we decided upon a format for the so-called “Challenge”. The general idea was to provide student teams with historical data on multiple bike stations and ask them to do some forecasting which we would then score based on a secret truth. The whole thing lasted from the 5th of October 2016 till the 26th of January 2017 when the best team was crowned.
The challenge was split into two phases. During the first phase, the teams were provided with data spanning from the 1st of April until the 5th of October at 10 AM. The data contained updates on the number of bikes at each station, the geographical position of the stations and the weather in each city. They were asked to forecast the number of bikes at 30 stations for 10 fixed timesteps ranging from the 5th of October at 10 AM until the 9th of October. We picked 10 stations from Toulouse, Lyon and Paris. Each team had access to an account page where they could deposit their submission which were then automatically scored. A public leaderboard was available at the homepage of the website Axel and I built.
During the second part of the challenge, which lasted from the 12th of January 2017 until the 20th of January 2017, the teams were provided with a new dataset containing similar data than the first part, except that Lyon has been swapped out for New-York. The data went from the 1st of April 2016 until the 11th of January 2017. The timesteps to predict were the same - both test sets went from a Wednesday till a Sunday. The teams did not get any feedback when they made a submission during the second part, they were scored based on their last submission, à l’aveugle.
In each part of the challenge the chosen metric to score the students was the mean absolute error between their submissions and the truth. The use of the MAE makes it possible to say things such as “team A was, on average, 3.2 bikes off target”.
Technical notes
Axel and I had been collecting freely available bike sharing data since October 2015. To do this we put in a place a homemade crawler which would interrogate various APIs and aggregate their data into a single format. We stored the number of bikes at each station at different timesteps with MongoDB. The metadata concerning the of the cities and the bike stations was stored with PostgreSQL. We also exposed an API to be able to use our data in an hypothetical mobile app. We deployed our crawler/API on a 20$ DigitalOcean server. The glue language was Python. The whole thing is available on GitHub.
To host the challenge I wrote a simple Django application (my first time!) which Axel kindly deployed on the same server as the crawler. The application used a SQLite as a database backend, partly because I wanted to try it out in production but because anything more powerful was unnecessary. Moreover SQLite stores its data in *.db file which can easily be transfered for doing some descriptive statistics. Again, the code is available on GitHub.
Results
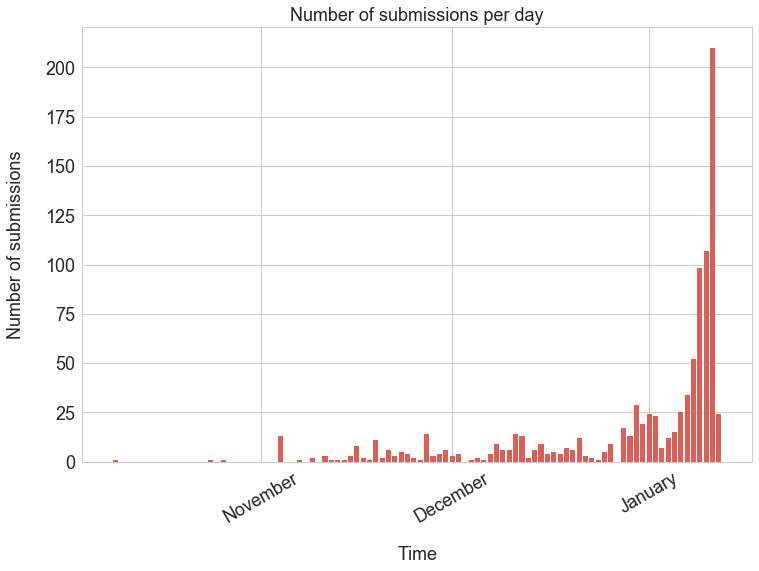
The turnout was quite high considering the fact that we didn’t put that much effort into the matter. All in all 8 curriculums and 50 teams took part in the challenge. A total of 947 valid submissions were made, which makes an average of 19 submissions per teams and 7 submissions a day - our server could easily handle that! Of course the rate at which teams submitted wasn’t uniform through time, as can be seen on the following chart.
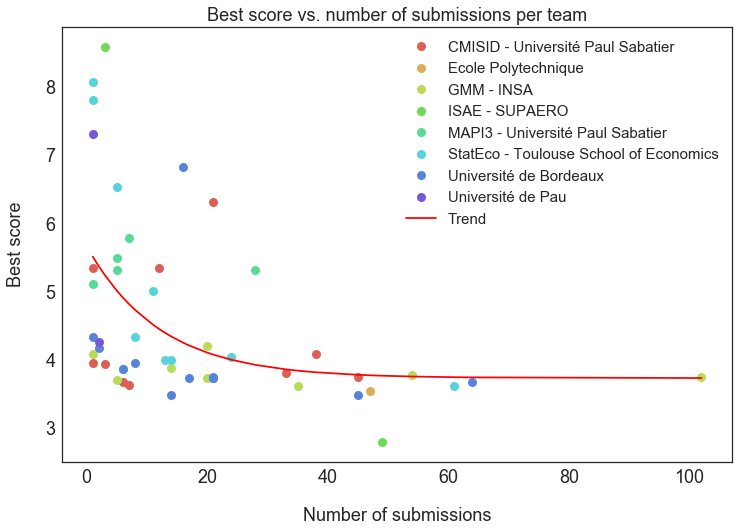
Philippe Besse suggested looking into the relationship between the number of submissions and the best score per team. The idea was to see if any overfitting had occured, in other words that the best scores were obtained by making many submissions with small adjustments. As can be seen on the following chart, an expected phenomenon arises: teams that have the best scores are usually the ones that have submitted more than others. Interestingly this becomes less obvious the more the teams submit, which basically means that getting a better score becomes harder and harder - this is always the case in data science competitions. To illustrate this phenomenon I fitted an exponential curve to the data.
The final public leaderboard (for the first part that is) was the following.
| Team name | Curriculum | Best score | Number of submissions |
|---|---|---|---|
| Dream Team | ISAE - SUPAERO | 2.7944230769230773 | 49 |
| Mr Nobody | Université de Bordeaux | 3.49 | 14 |
| Oh l'équipe | Université de Bordeaux | 3.49 | 45 |
| PrédiX | Ecole Polytechnique | 3.5402333333332323 | 47 |
| Louison Bobet | StatEco - Toulouse School of Economics | 3.61 | 61 |
| Armstrong | GMM - INSA | 3.62 | 35 |
| OpenBikes | CMISID - Université Paul Sabatier | 3.62930918737076 | 7 |
| Ravenclaw | Université de Bordeaux | 3.67 | 64 |
| LA ROUE ARRIÈRE | CMISID - Université Paul Sabatier | 3.679264355300685 | 6 |
| WeLoveTheHail | GMM - INSA | 3.703333333333333 | 5 |
| GMMerckx | GMM - INSA | 3.7266666666666666 | 20 |
| TEAM_SKY | Université de Bordeaux | 3.7333333333333334 | 17 |
| zoomzoom | Université de Bordeaux | 3.7333333333333334 | 21 |
| KAMEHAMEHA | Université de Bordeaux | 3.7333333333333334 | 21 |
| Tricycles | GMM - INSA | 3.743333333333333 | 102 |
| AfricanCommunity | CMISID - Université Paul Sabatier | 3.7480411895507957 | 45 |
| Avermaert | Université de Bordeaux | 3.75 | 21 |
| ZiZou98 <3 | GMM - INSA | 3.776666666666667 | 54 |
| LesCyclosTouristes | CMISID - Université Paul Sabatier | 3.8066666666666666 | 33 |
| Ul-Team | Université de Bordeaux | 3.8619785774274002 | 6 |
| Les Grosses Données | MAPI3 - Université Paul Sabatier | 3.866305333958716 | 6 |
| H2O | GMM - INSA | 3.8833333333333333 | 14 |
| RYJA Team | CMISID - Université Paul Sabatier | 3.9366666666666665 | 3 |
| NSS | Université de Bordeaux | 3.9476790826017845 | 8 |
| Pas le temps de niaiser | CMISID - Université Paul Sabatier | 3.9486790826017866 | 1 |
| TheCrazyInsaneFlyingMonkeySpaceInvaders | StatEco - Toulouse School of Economics | 4.003399297813541 | 14 |
| Jul saint-Jean-la-Puenta | StatEco - Toulouse School of Economics | 4.003399297813541 | 13 |
| Four and one | StatEco - Toulouse School of Economics | 4.04 | 24 |
| test | CMISID - Université Paul Sabatier | 4.088626133087001 | 38 |
| Pedalo | GMM - INSA | 4.088626133087581 | 1 |
| alela | Université de Bordeaux | 4.173333333333333 | 2 |
| MoAx | GMM - INSA | 4.199905182463245 | 20 |
| Pas de Pau | Université de Pau | 4.25912069022148 | 2 |
| Le Gruppetto | StatEco - Toulouse School of Economics | 4.333333333333333 | 8 |
| Lolilol | Université de Bordeaux | 4.338140757878622 | 1 |
| DataScientist2017 | StatEco - Toulouse School of Economics | 5.003333333333333 | 11 |
| SRAM | MAPI3 - Université Paul Sabatier | 5.10472813815054 | 1 |
| Outliers | MAPI3 - Université Paul Sabatier | 5.3133333333333335 | 28 |
| Jean Didier Vélo ♯♯ | MAPI3 - Université Paul Sabatier | 5.3133333333333335 | 5 |
| Velouse | CMISID - Université Paul Sabatier | 5.343147845575032 | 12 |
| TEAM NNBJ | CMISID - Université Paul Sabatier | 5.343147845575032 | 1 |
| MAPI3 - Université Paul Sabatier | 5.49 | 5 | |
| JMEG | MAPI3 - Université Paul Sabatier | 5.783141628450403 | 7 |
| player | CMISID - Université Paul Sabatier | 6.3133333333333335 | 21 |
| TSE-BigData | StatEco - Toulouse School of Economics | 6.536927792628606 | 5 |
| kangou | Université de Bordeaux | 6.826666666666667 | 16 |
| On aura votre Pau Supaéro | Université de Pau | 7.306310702178721 | 1 |
| Les Pédales | StatEco - Toulouse School of Economics | 7.803333333333334 | 1 |
| BIKES FINDERS | StatEco - Toulouse School of Economics | 8.07 | 1 |
| Université Bordeaux Enseignants | ISAE - SUPAERO | 8.59 | 3 |
| Pedalo | GMM - INSA | 8.876666666666667 | 1 |
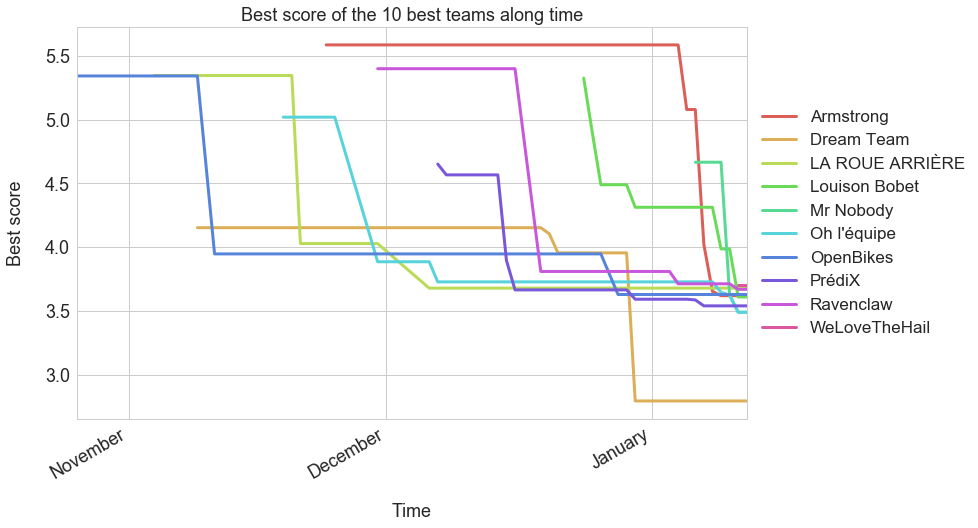
Congratulations to team “Dream Team” for winning, by far, the first part of the challenge. The rest of best teams seem to have hit a wall at ~3.6 bikes. This can be seen on the following chart which shows the best score of the 10 best teams along time.
As for the ranking for the second part of the challenge (the blindfolded part), here is the final ranking:
| Team name | Curriculum | Best score |
|---|---|---|
| Le Gruppetto | StatEco - Toulouse School of Economics | 3.2229284855662748 |
| OpenBikes | CMISID - Université Paul Sabatier | 3.73651042834827 |
| Louison Bobet | StatEco - Toulouse School of Economics | 3.816666666666667 |
| Mr Nobody | Université de Bordeaux | 3.94 |
| Oh l'équipe | Université de Bordeaux | 3.953333333333333 |
| Ravenclaw | Université de Bordeaux | 4.05 |
| Tricycles | GMM - INSA | 4.24 |
| Four and one | StatEco - Toulouse School of Economics | 4.45 |
| PrédiX | Ecole Polytechnique | 4.523916666666766 |
| WeLoveTheHail | GMM - INSA | 4.596666666666667 |
| ZiZou98 <3 | 4.596666666666667 | |
| Dream Team | ISAE - SUPAERO | 4.6402666666666725 |
| GMMerckx | GMM - INSA | 4.706091376666668 |
| LA ROUE ARRIÈRE | CMISID - Université Paul Sabatier | 4.711600488605138 |
| Avermaert | Université de Bordeaux | 4.74 |
| TSE-BigData | StatEco - Toulouse School of Economics | 4.754570707888592 |
| Pedalo | GMM - INSA | 4.755557911517161 |
| test | CMISID - Université Paul Sabatier | 4.755557911517161 |
| Armstrong | GMM - INSA | 4.87 |
| H2O | GMM - INSA | 4.93 |
| LesCyclosTouristes | CMISID - Université Paul Sabatier | 4.963333333333333 |
| AfricanCommunity | CMISID - Université Paul Sabatier | 4.977632664232967 |
| TheCrazyInsaneFlyingMonkeySpaceInvaders | StatEco - Toulouse School of Economics | 5.092628340778687 |
| NSS | Université de Bordeaux | 5.2957133684308015 |
| Ul-Team | Université de Bordeaux | 5.374689402650746 |
| Les Pédales | StatEco - Toulouse School of Economics | 5.492804691024131 |
| Les Grosses Données | MAPI3 - Université Paul Sabatier | 5.62947781887139 |
| Velouse | CMISID - Université Paul Sabatier | 5.666666666666668 |
| DataScientist2017 | StatEco - Toulouse School of Economics | 5.756666666666668 |
| JMEG | MAPI3 - Université Paul Sabatier | 5.981138200799902 |
| RYJA Team | CMISID - Université Paul Sabatier | 6.026666666666666 |
| BIKES FINDERS | StatEco - Toulouse School of Economics | 6.076666666666667 |
| TEAM_SKY | Université de Bordeaux | 6.123333333333332 |
| KAMEHAMEHA | Université de Bordeaux | 6.123333333333332 |
| zoomzoom | Université de Bordeaux | 6.123333333333332 |
| MAPI3 - Université Paul Sabatier | 6.246666666666667 | |
| Outliers | MAPI3 - Université Paul Sabatier | 7.926666666666668 |
| TEAM NNBJ | CMISID - Université Paul Sabatier | 8.243333333333334 |
| MoAx | GMM - INSA | 10.946772841269727 |
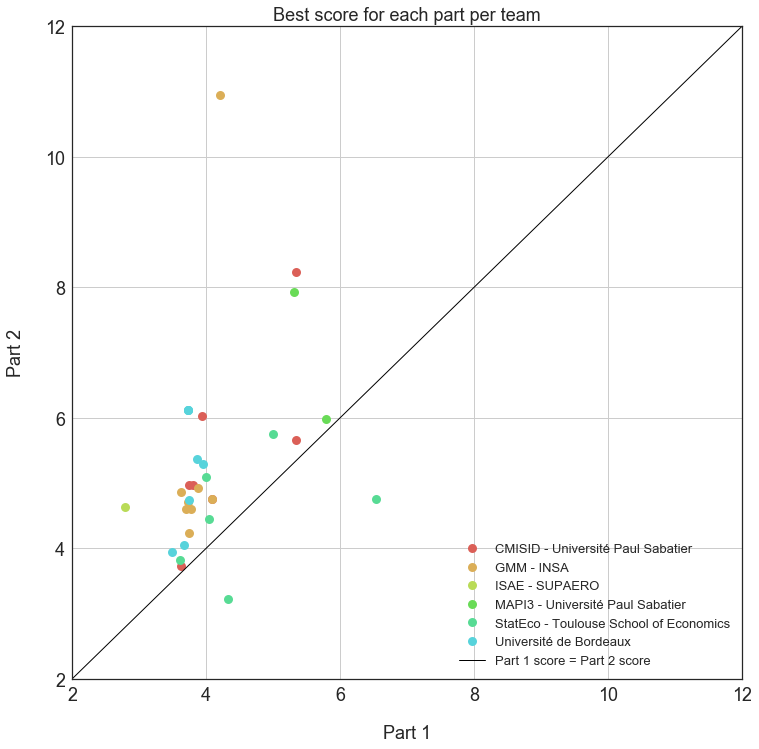
Team “Le Gruppetto” is officially the winner of the challenge! The fact that the second part of the competition was blindfolded completely reversed the rankings and favored teams with robust methods whilst penalizing overfitters. What’s more, “only” 39 teams took part in the second part (50 did in the first one); maybe some teams felt that their ranking wouldn’t change, but the fact is that “Le Gruppetto” were 34th before being 1st. It isn’t over till the fat lady sings. The following chart shows the best score per team for both parts of the challenge.
Who used what?
Every team was asked to submit their code for the second submission. Mostly this was required to make sure no team had cheated by retrieving the data from an API, however this was also the occasion to see what tools the students were using. Here is a brief summary:
- 23 teams used R (mostly xgboost, dplyr, gbm, randomForest, caret)
- 19 teams used random forests
- 15 teams used Python (mostly pandas and sklearn)
- 8 teams used some form of averaging (which isn’t really machine learning), 5 went further and used the averages as features
- 7 teams used gradient boosted trees
- 4 teams used Jupyter with Python
- 3 teams used model stacking (they averaged the outputs of their individual models)
- 3 teams used vanilla linear regression
- 2 teams averaged the number of bikes in the surrounding stations
- 2 teams used randomized decision trees (they did fairly well)
- 2 teams used $k$ nearest neighbours
- 1 team used RMarkdown
- 1 team used LASSO regression
- 1 team used a CART
- 1 team used a SARIMA process
- 1 team used a recurrent neural network (me!)
- 1 team used dynamic time warping
- 1 team used principal component analysis
An interesting fact is that out of the 7 teams who used Python, 4 used it for preparing their data but coded their model in R.
The winners of first part used a random forest, dynamic time warping and principal component decomposition - their Python code is quite hard to grasp! As for the winners of the second part, they coded in R and looked at surrounding stations whilst using gradient boosted trees.
Conclusion
I would like to thank all the students and teachers that participated from the following schools:
- Université Paul Sabatier, 19 teams
- Toulouse School of Economics, 13 teams
- Université de Bordeaux, 13 teams
- INSA Toulouse, 10 teams
- ISAE - SUPAERO, 2 teams
- Université de Pau, 2 teams
- Ecole Polytechnique (l’X), 1 team
Personally I had a great experience organization wise. I had a few panic attacks whilst preparing the CSV files and updating the website, but generally everything went quite smoothly. As a participant my feelings were more mixed; to be totally honest I wasn’t very inclined to participate. It’s difficult to do in front and behind the stage!
Datasets
I’ve made the datasets that were used during both parts of the challenge available - including the true answers - click on this link to download them. Edit in 2024: this link is now dead, but you can find a lot of bike sharing data here.
Feel free to email me if you have any questions.