Unknown pleasures with JavaScript
No this blog post is not about how nice JavaScript can be, instead it’s just another one of my attempts at reproducing modern art with procedural generation and the HTML5 <canvas> element. This time I randomly generated images resembling the cover of the album by Joy Division called “Unknown Pleasures”.
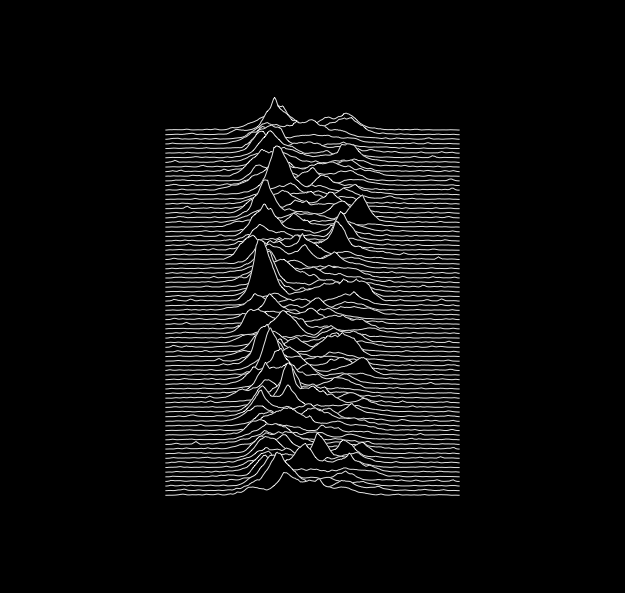
According to Wikipedia, this somewhat iconic album cover is based on radio waves. I saw a poster of it in a bar not long ago and decided to reproduce the next time I had some time to kill.
First of all let’s set up a black canvas - I used the same dimensions as the image above.
<canvas id="doodle" width="625" height="593"></canvas>
var canvas = document.getElementById('doodle')
var ctx = canvas.getContext('2d')

ctx.fillStyle = 'black'
ctx.fillRect(0, 0, canvas.width, canvas.height)
Next I manually guessed some margins.
var xMin = 140
var xMax = canvas.width - xMin
var yMin = 100
var yMax = canvas.height - yMin
I squinted my eyes to count the number of lines on the album cover and I believe there are 80 of them. Based on the height $h$ and the number of lines $l$ the distance between each line is simply $dy = \frac{h}{l}$. The same goes for the width and desired number of points on each line.
var nLines = 80
var nPoints = 100

var dx = (xMax - xMin) / nPoints
var dy = (yMax - yMin) / nLines
My “strategy” is to use two nested loops to iterate each line one by one. For example the following snippets draws nLines lines evenly spaced by dy each consisting of nPoints points which are themselves evenly spaced by dx. Essentially this just requires updating the $x$ and $y$ coordinates respectively by dx and dy. When a line ends the x variable resets to xMin in order to start a new line.
var x = xMin
var y = yMin

for (var i = 0; i < nLines; i++) {
  for (var j = 0; j < nPoints; j++) {
    x = x + dx
    ctx.lineTo(x, y)
  }
  x = xMin
  y = y + dy
  ctx.moveTo(x, y)
}

ctx.lineWidth = 1.2
ctx.strokeStyle = 'white'
ctx.stroke()
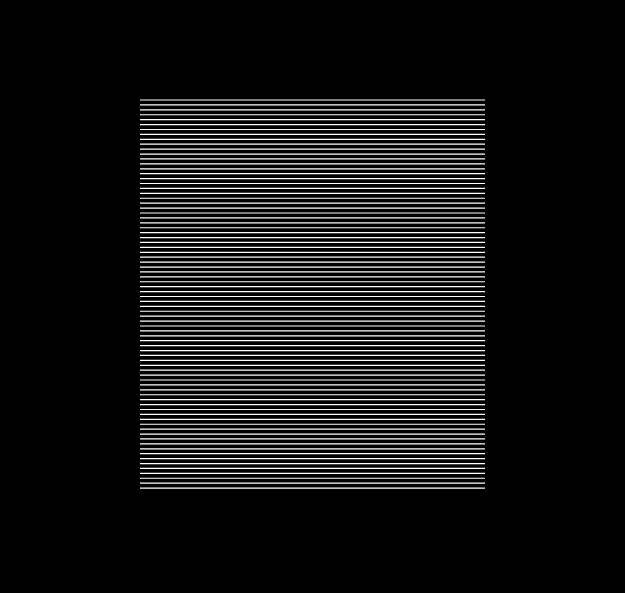
The randomness in the album cover comes from the $y$ coordinate. For example by adding values obtained from a uniform distribution in $[0, 1]$ - this is easily done by replacing ctx.lineTo(x, y) by ctx.lineTo(x, y + Math.random()) - the lines start to jitter around.
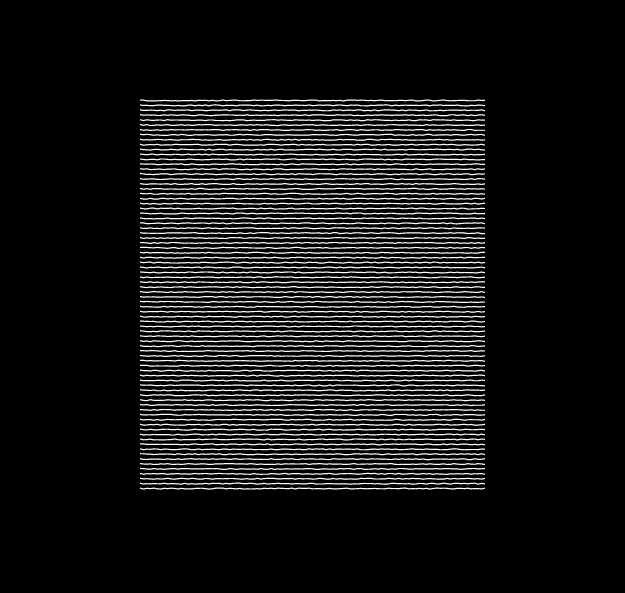
Of course the noise in the album cover is not uniform at all, in fact each line has multiple “peaks” which points the way towards multimodal distributions. It seems that each line has one or more peaks, moreover some of the peaks are skewed towards the left or the right. Although the distributions don’t seem to be normal, using a mixture distribution composed of multiple normal distributions seems to be a reasonably good start.
To obtain values for $y$ we have to use the probability density function – in short PDF – of each normal distribution. Basically for each $x_i$ the PDF will tell us the associated value $y_i$. To make the process different per line we can sample a mean $\mu$ and a standard deviation $\sigma$ from two normal distributions – one for each parameter – that we can then inside another normal distribution whose PDF will be used to generate values for $y$.
Sadly the JavaScript standard library doesn’t provide a function to sample from a normal distribution. I didn’t want to use an external library so I decided to implement my own. Although there exist fancy techniques with even fancier names – I’m looking at you Ziggurat algorithm – a simple way of going is simply to compute the average of values sampled from a uniform distribution.
function rand (min, max) {
  return Math.random() * (max - min) + min
}

function randNormal () {
  var sum = 0
  for (var i = 0; i < 6; i += 1) {
    sum += rand(-1, 1)
  }
  return sum / 6
}
The randNormal function will generate values centered around 0 with a standard deviation of 1. The reason why this technique is not popular is because the values it produces will necessarily be in range $[-6, 6]$ – because of the sum. The 6 is arbitrary and any value higher would increase the precision of the method while any lower value is not recommended. Because we are procedural generation we don’t really care about the precision of our methods, in fact noise and imprecision is welcome!
randNormal can be extended to sample from a normal distribution with mean mu and standard deviation sigma.
function randNormal (mu, sigma) {
  var sum = 0
  for (var i = 0; i < 6; i += 1) {
    sum += rand(-1, 1)
  }
  var norm = sum / 6
  return mu + sigma * norm
}
Finally the PDF of a normal distribution is $f(x) = \frac{1}{\sqrt{2\pi\sigma^2}}e^{-\frac{(x-\mu)^2}{2\sigma^2}}$, which translates to the following JavaScript code.
function normalPDF (x, mu, sigma) {
  var sigma2 = Math.pow(sigma, 2)
  var numerator = Math.exp(-Math.pow((x - mu), 2) / (2 * sigma2))
  var denominator = Math.sqrt(2 * Math.PI * sigma2)
  return numerator / denominator
}
Now we can generate a normal distribution with random parameters for each line and obtain each $y_i$ thanks to the PDF of the generated normal distributions.
var mx = (xMin + xMax) / 2

for (var i = 0; i < nLines; i++) {
  // Generate random parameters for the line's normal distribution
  var mu = randNormal(mx, 50)
  var sigma = randNormal(30, 30)
  for (var j = 0; j < nPoints; j++) {
    x = x + dx
    ctx.lineTo(x, y - 1000 * normalPDF(x, mu, sigma))
  }
  x = xMin
  y = y + dy
  ctx.moveTo(x, y)
}
mu and sigma are sampled from normal distributions with manually chosen parameters. mx is half the length of each line. The 1000 is also arbitrary and is simply there to rescale the values returned by the PDF so that they are meaningful, again this is done manually.
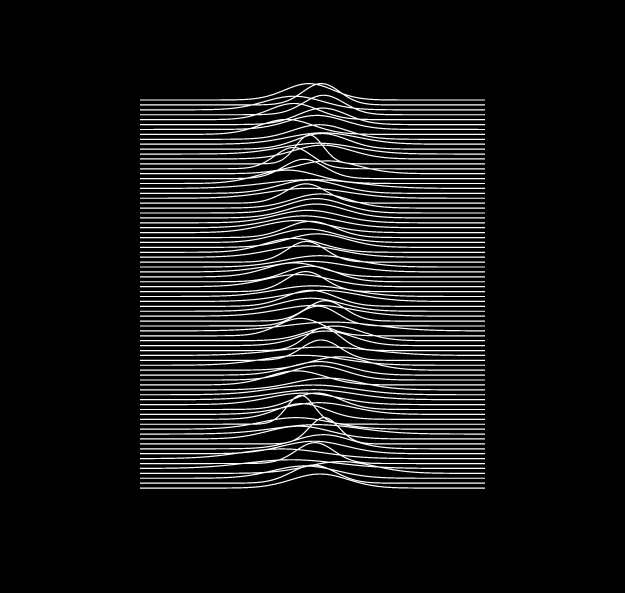
We’re getting somewhere! However one issue that has nothing to do with randomness is that the lines sometimes overlap whereas they do not in the album cover. One way to solve this is to draw black pixels under each line to “cover up” the previous lines. This is quite easy to do with the fill method. At the end of each line we fill in all the area under the current line in black, then we paint the current line in white before finally moving to the next line.
ctx.fillStyle = 'black'
ctx.strokeStyle = 'white'

for (var i = 0; i < nLines; i++) {
  ctx.beginPath()
  // Generate random parameters for the line's normal distribution
  var mu = randNormal(mx, 50)
  var sigma = randNormal(30, 30)
  for (var j = 0; j < nPoints; j++) {
    x = x + dx
    ctx.lineTo(x, y - 1000 * normalPDF(x, mu, sigma))
  }
  // Cover the previous lines
  ctx.fill()
  // Draw the current line
  ctx.stroke()
  // Go to the next line
  x = xMin
  y = y + dy
  ctx.moveTo(x, y)
}
This procedure gives a satisfying 3D feel to the image.
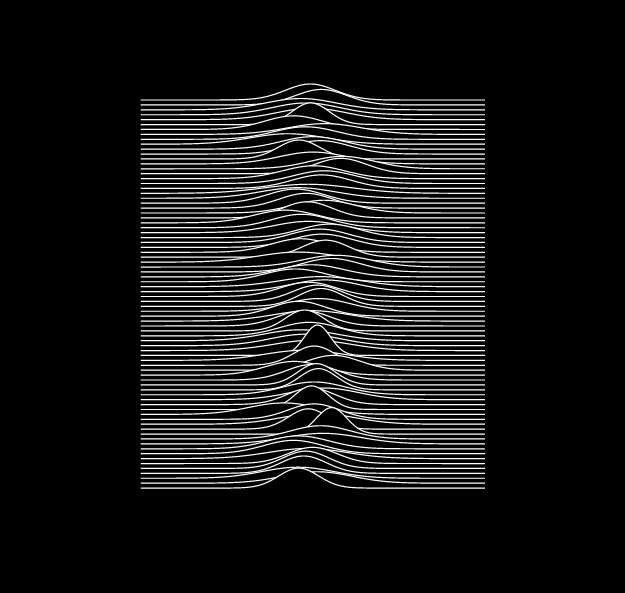
Now all we have to do is generate more resembling lines. As I mentioned the lines have multiple peaks and using a multimodal distribution could do well. To generate an arbitrary multimodal distribution one may use a mixture distribution, which is nothing more than sum over two or more distributions. For example the following figure – obtained from the Wikipedia page on mixture distributions – shows how summing three normal distributions results in a new distributions with three modes.
Producing a mixture distribution is not too complex code-wise. For each line we want to generate a multimodal distribution with a random number of modes, thus we can first of all assign a random integer to a variable called nModes to indicate how many modes we want. Then we can generate nModes values for $\mu$ and for $\sigma$ just as we did previously. Then we can sum returned by the PDF of each distribution and use the sum as a value for $y$.
function randInt (min, max) {
  return Math.floor(Math.random() * (max - min + 1)) + min
}

for (var i = 0; i < nLines; i++) {
  ctx.beginPath()
  var nModes = randInt(1, 4)
  // Generate random parameters for the line's normal distribution
  var mus = []
  var sigmas = []
  for (var j = 0; j < nModes; j++) {
    mus[j] = randNormal(mx, 100)
    sigmas[j] = randNormal(24, 30)
  }
  for (var k = 0; k < nPoints; k++) {
    x = x + dx
    var noise = 0
    for (var l = 0; l < nModes; l++) {
      noise += normalPDF(x, mus[l], sigmas[l])
    }
    ctx.lineTo(x, y - 1000 * noise)
  }
  ctx.fill()
  ctx.stroke()
  x = xMin
  y = y + dy
  ctx.moveTo(x, y)
}
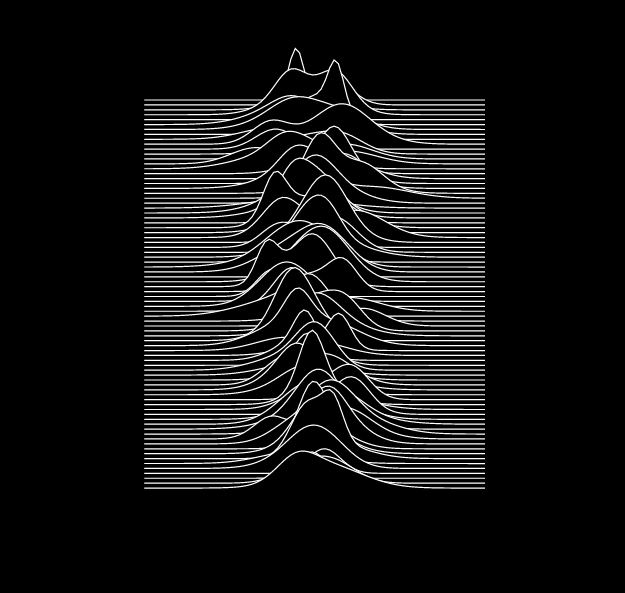
Again we are getting closer. Now probably should work on some noise. Instead of adding some random as we did previously we could make the noise be proportionate to $y$. After some tinkering I found that the following worked quite well.
var yy = y - (500 + Math.random() * 200) * noise + Math.random()
ctx.lineTo(x, yy)
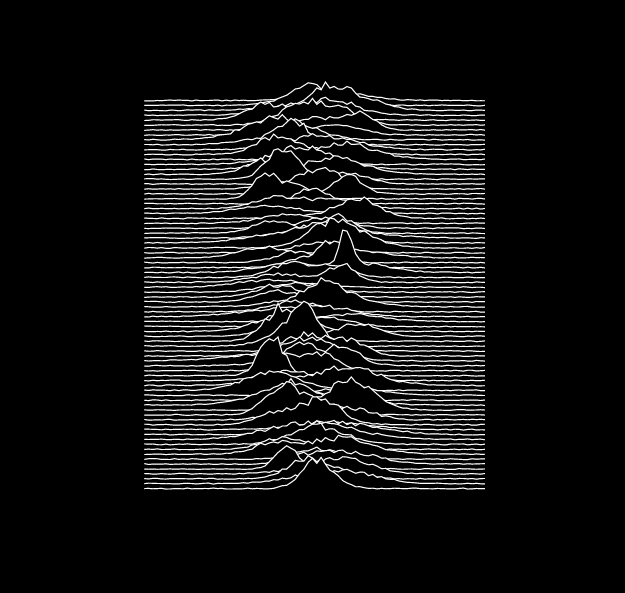
At this moment I was quite happy with the result. However, after looking at a few runs I had a feeling that the lines oscillated too much and that they should be a bit smoother. The thing is that for each value of $x$ we produce a value for $y$ that does not take account the preceding value. I decided to use a basic smoothing function so each value $y_i$ would take into account the previous value $y_{i-1}$. In the end I settled on doing $y_i = 0.7 \times f(x) - 0.3 \times y_{i-1}$. Implementing this rolling mean only requires the last value of $y$ at each iteration; I settled on the following code which does just so.
for (var i = 0; i < nLines; i++) {
  ctx.beginPath()
  var nModes = randInt(1, 4)
  var mus = []
  var sigmas = []
  for (var j = 0; j < nModes; j++) {
    mus[j] = rand(mx - 50, mx + 50)
    sigmas[j] = randNormal(24, 30)
  }
  var w = y
  for (var k = 0; k < nPoints; k++) {
    x = x + dx
    var noise = 0
    for (var l = 0; l < nModes; l++) {
      noise += normalPDF(x, mus[l], sigmas[l])
    }
    var yy = 0.3 * w + 0.7 * (y - 600 * noise + noise * Math.random() * 200 + Math.random())
    ctx.lineTo(x, yy)
    w = yy
  }
  ctx.fill()
  ctx.stroke()
  x = xMin
  y = y + dy
  ctx.moveTo(x, y)
}
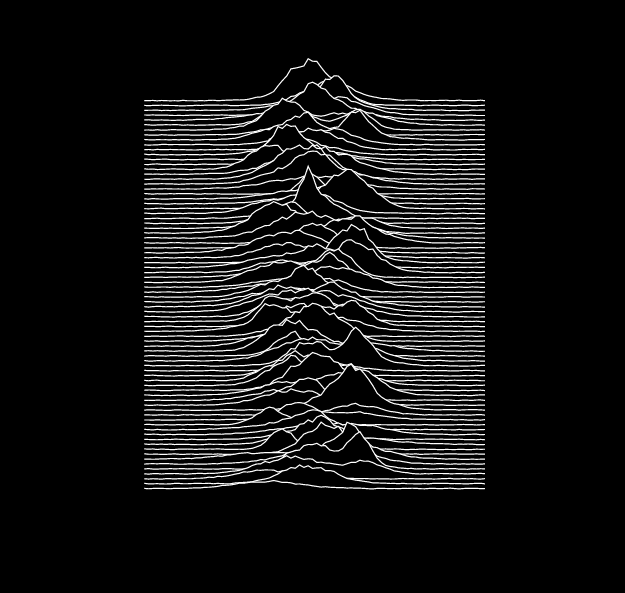
And that wraps it for this post, I hope you enjoyed it! As usual the final is available on GitHub with the rest of procedural generation I did.
On a side note I discovered the r/proceduralgeneration subreddit which I recommend if you’re interested in procedural generation – albeit more advanced than what I do.